Streamline and develop FP&A with Finadeck
- Combine economic and operational business data
- Build, visualize, and automate the reports you want for the people you want
- Create budgets, forecasts and scenarios more easily than ever before
Finadeck supports corporate, community, and real estate cher bedroom charts
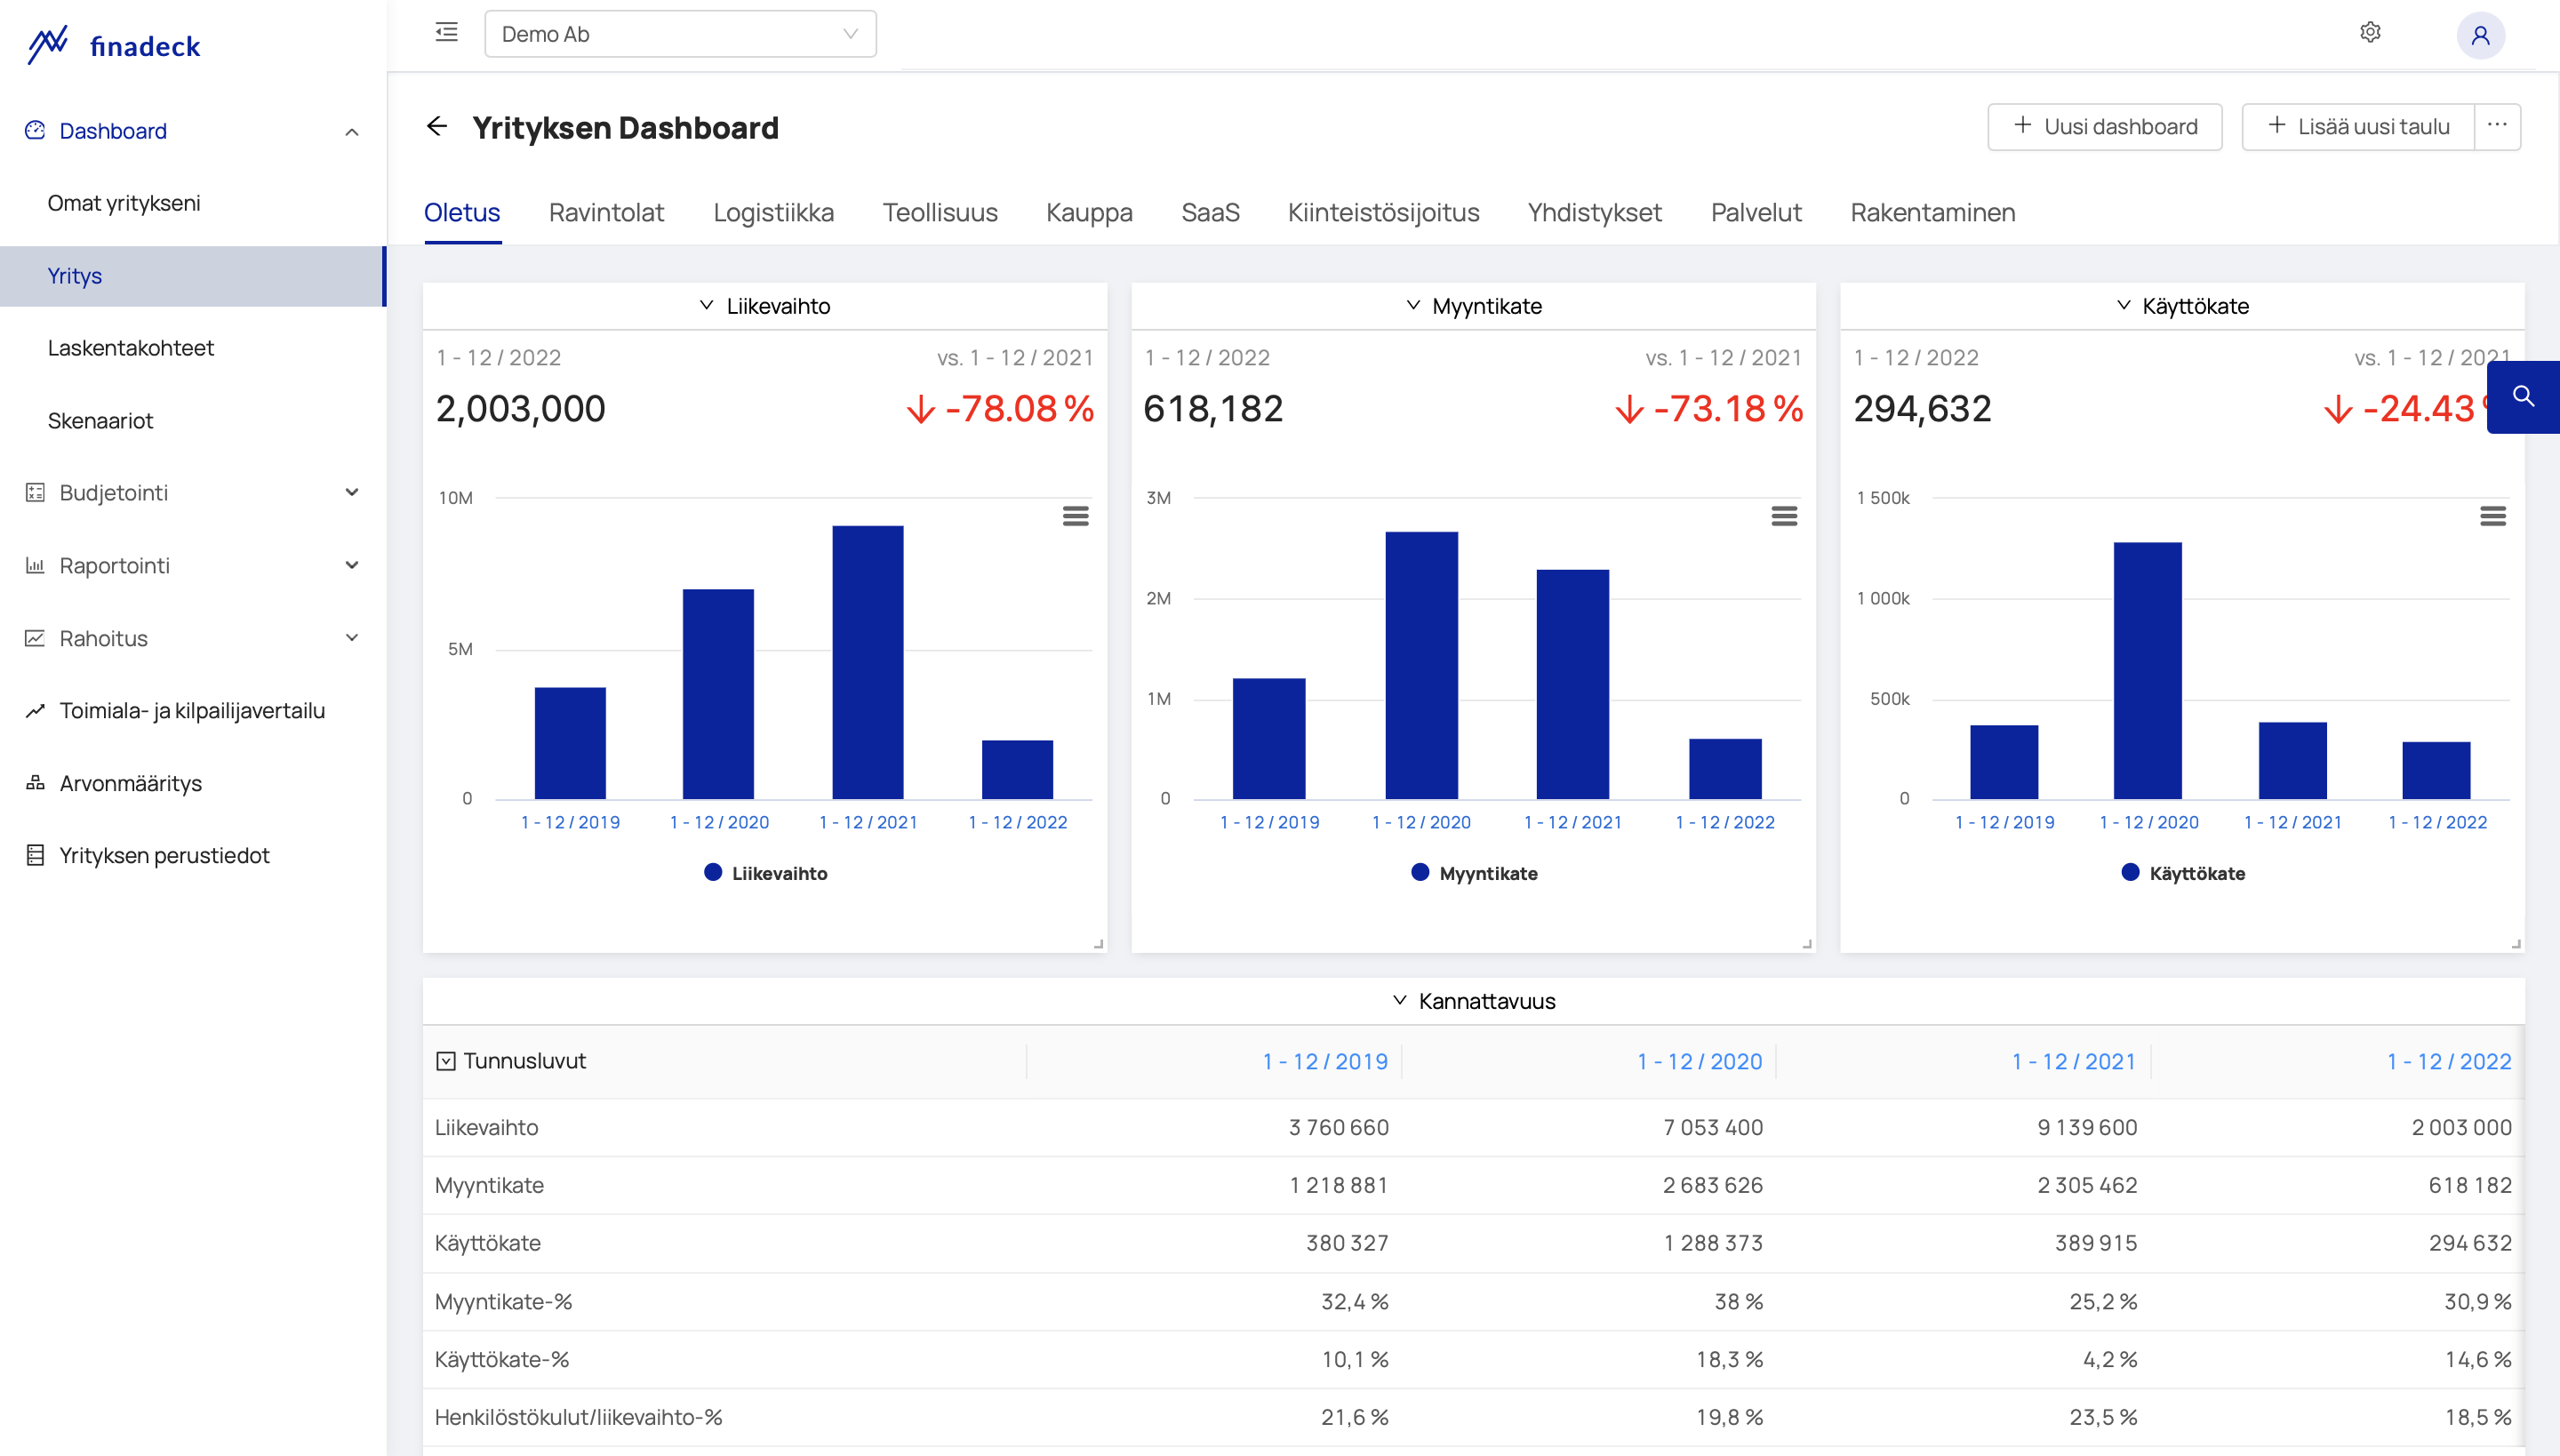
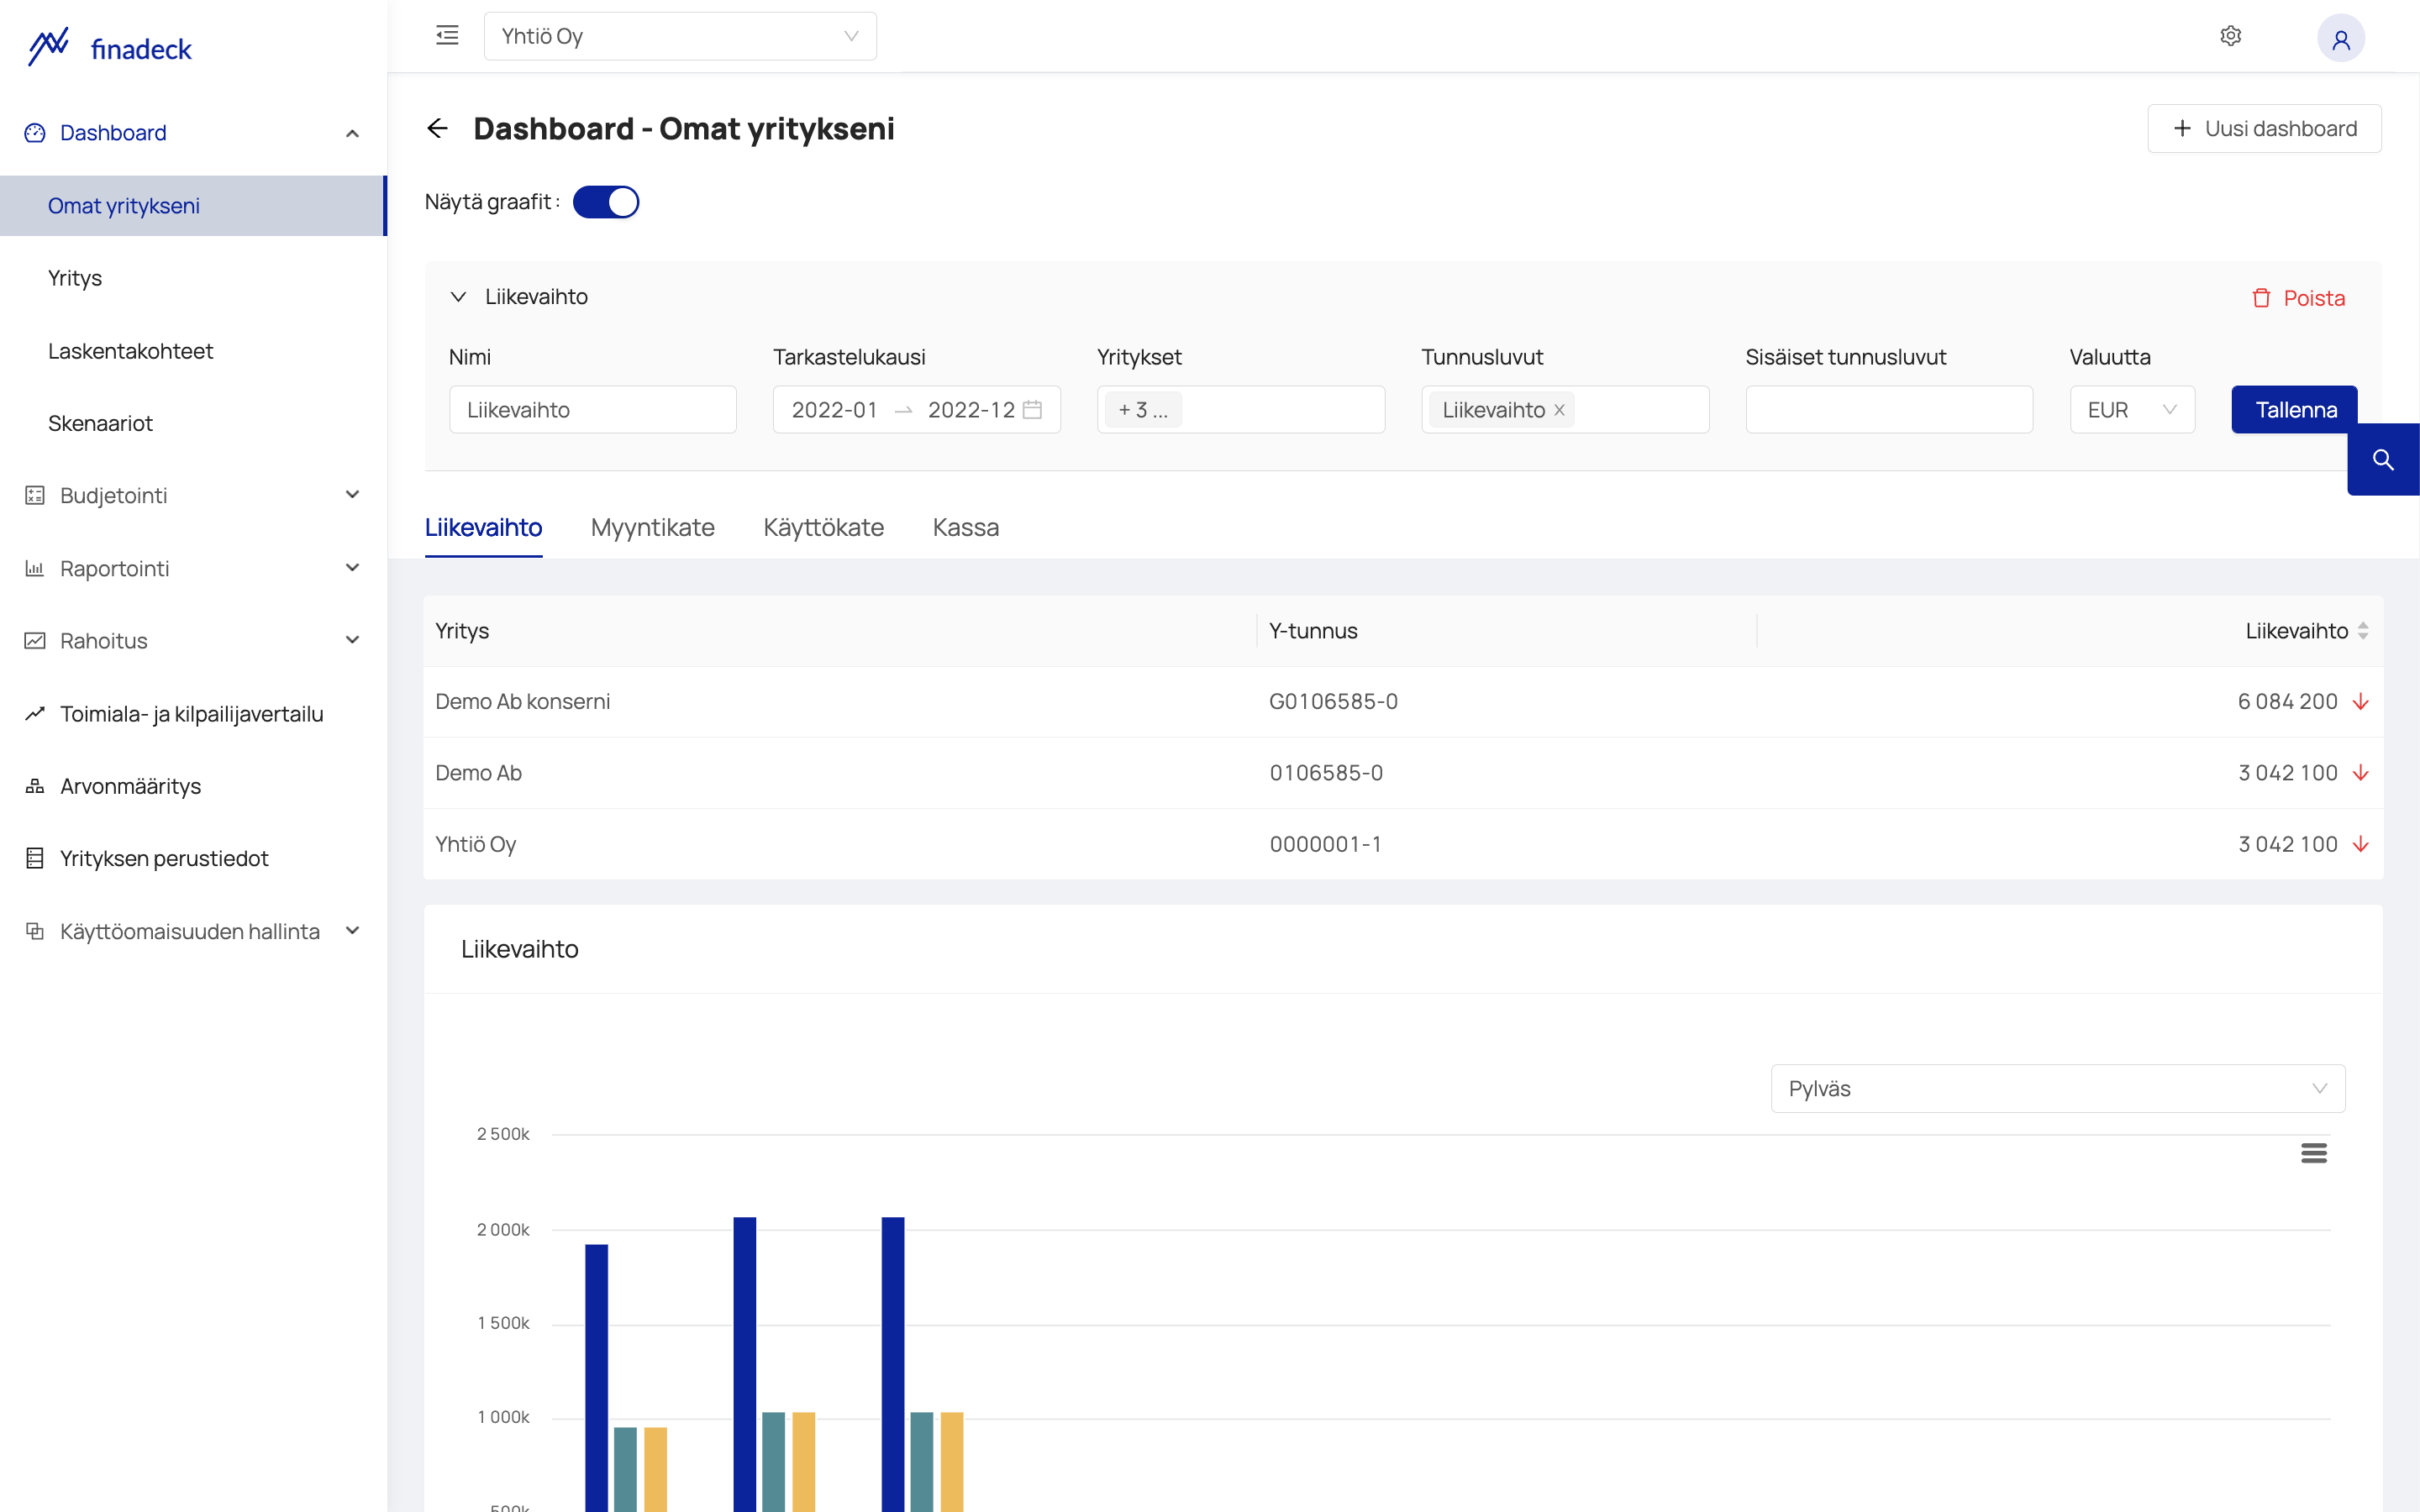
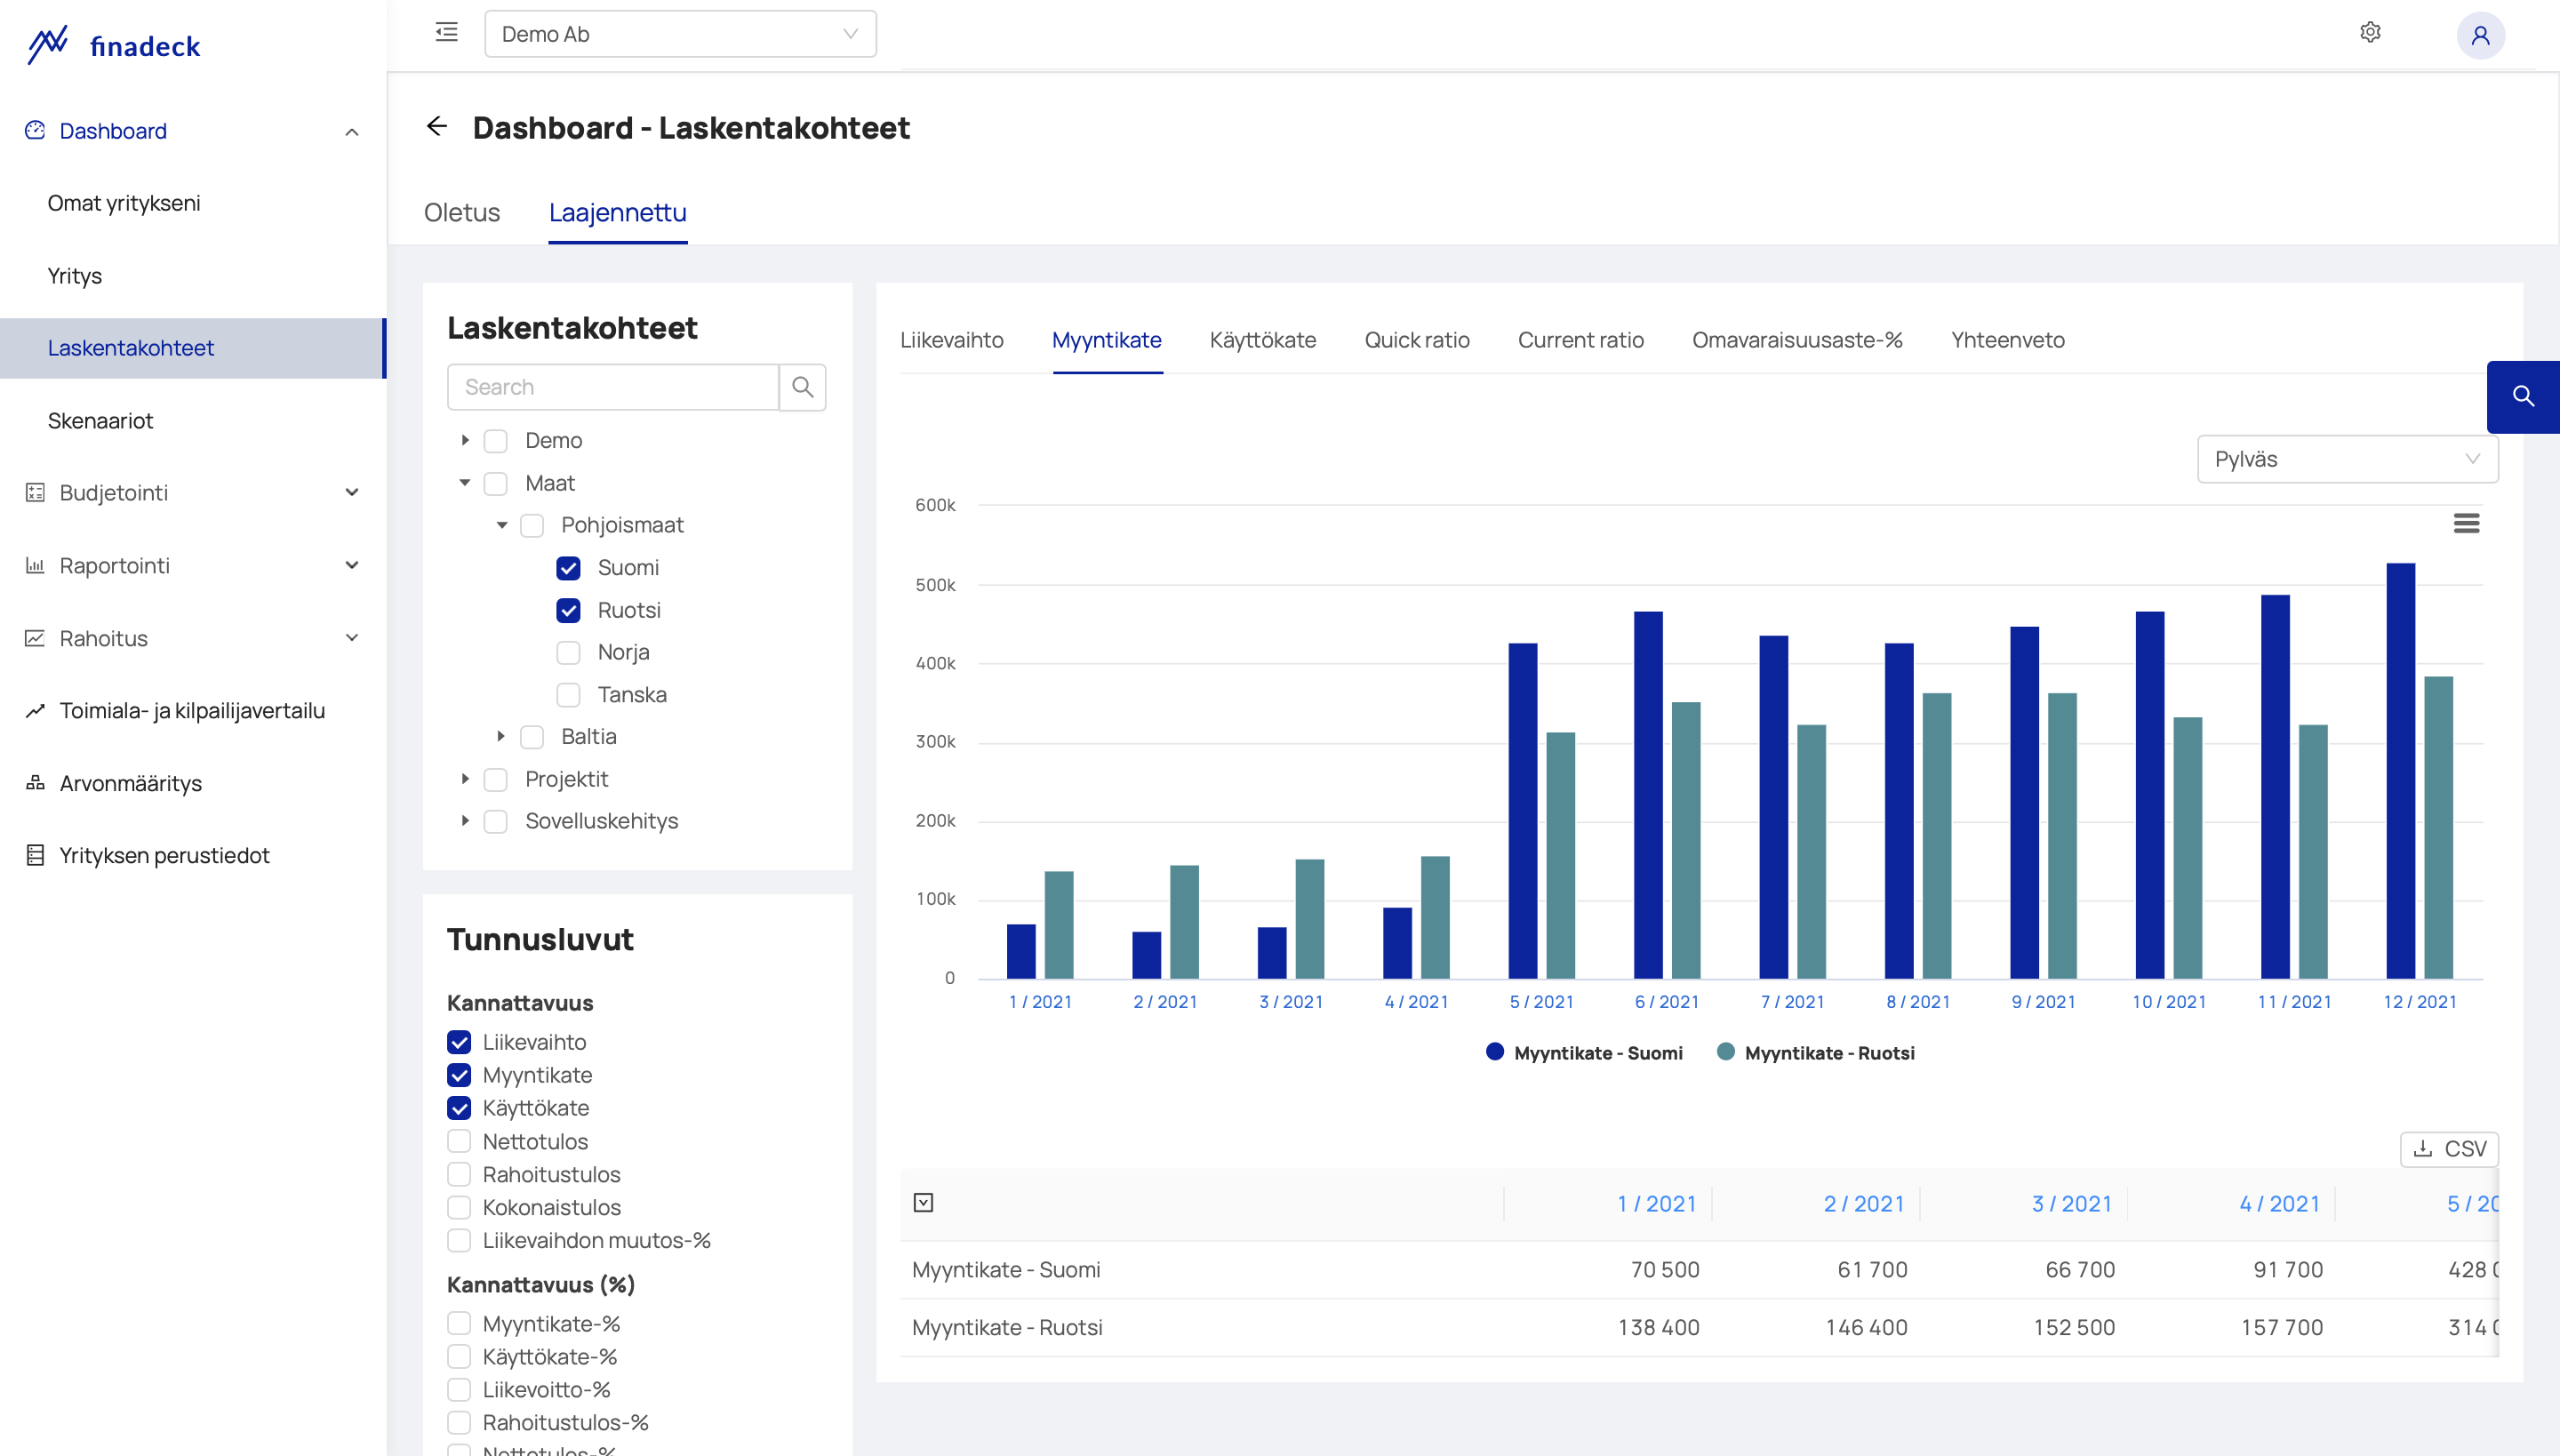
Dashboards
Ready-made and easy-to-edit dashboards for different tracking levels:
- Cluster of companies / group / franchise chain
- Company
- Calculation items
With Finadeck's group environment, you can make the necessary eliminations and automate group reporting.
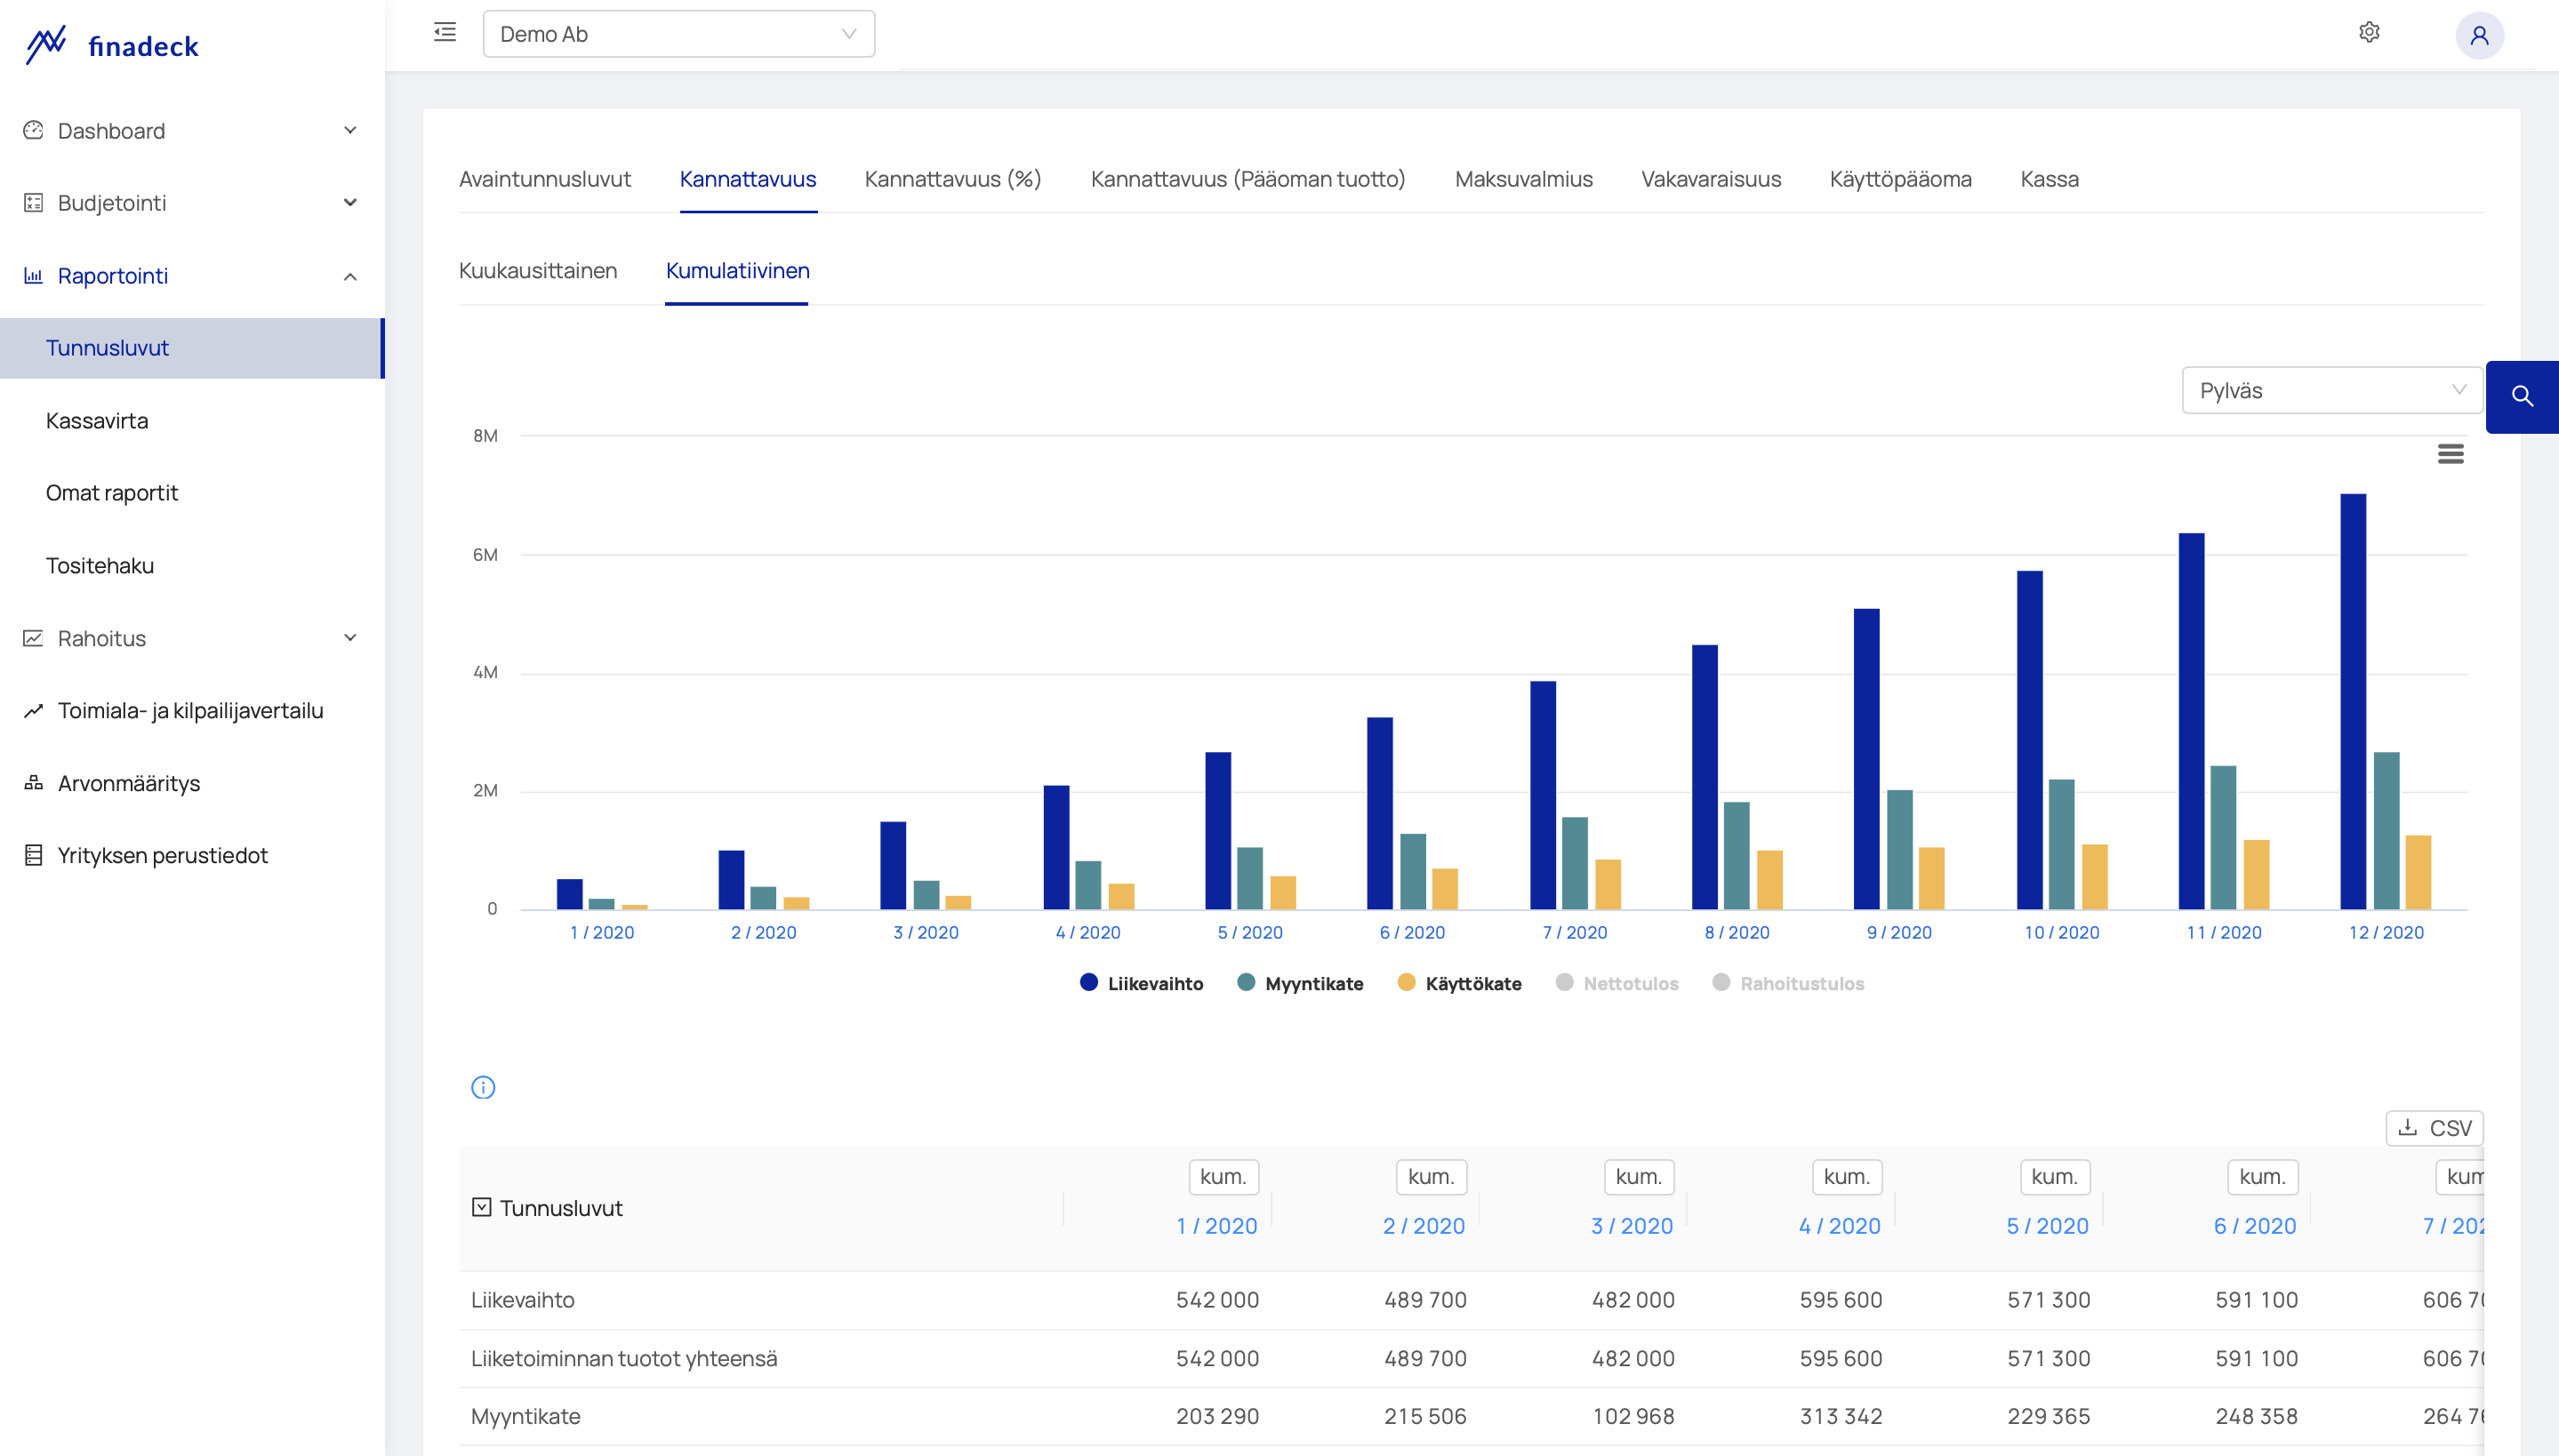
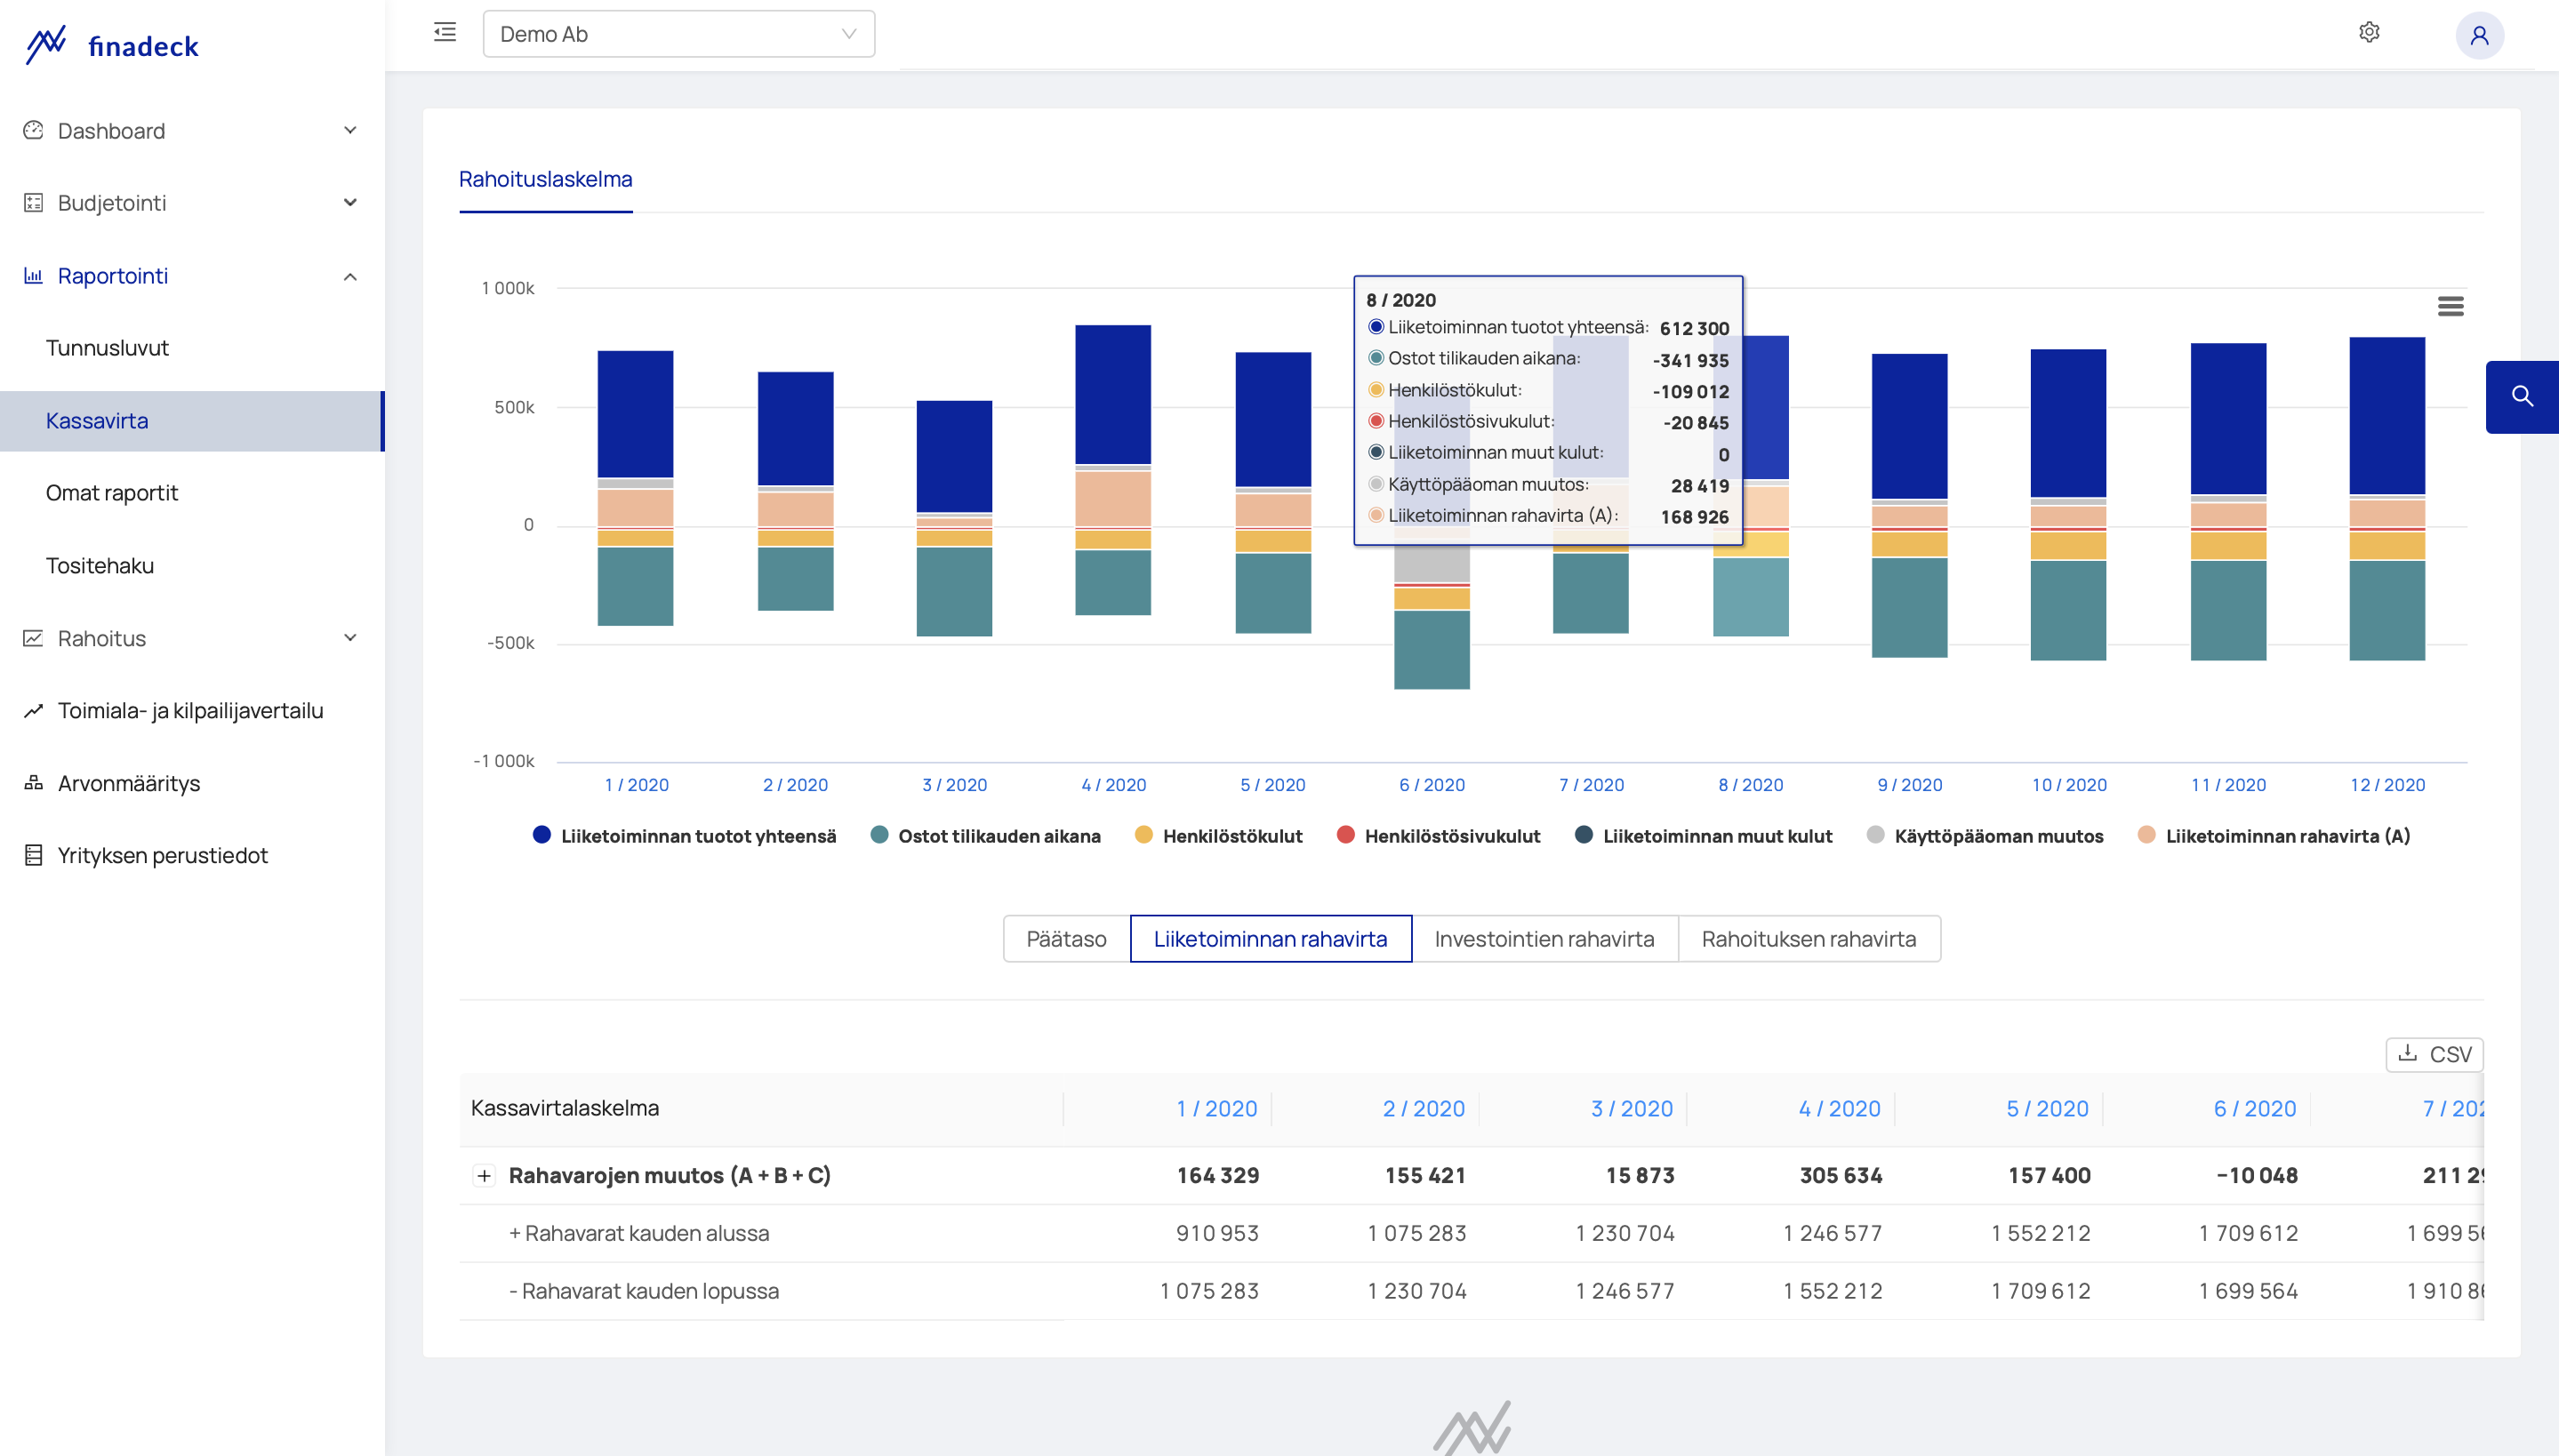
Key figures and cash flow
- tables and graphs for standard id numbers
- drill-down cash flow statement and cash flow graphs
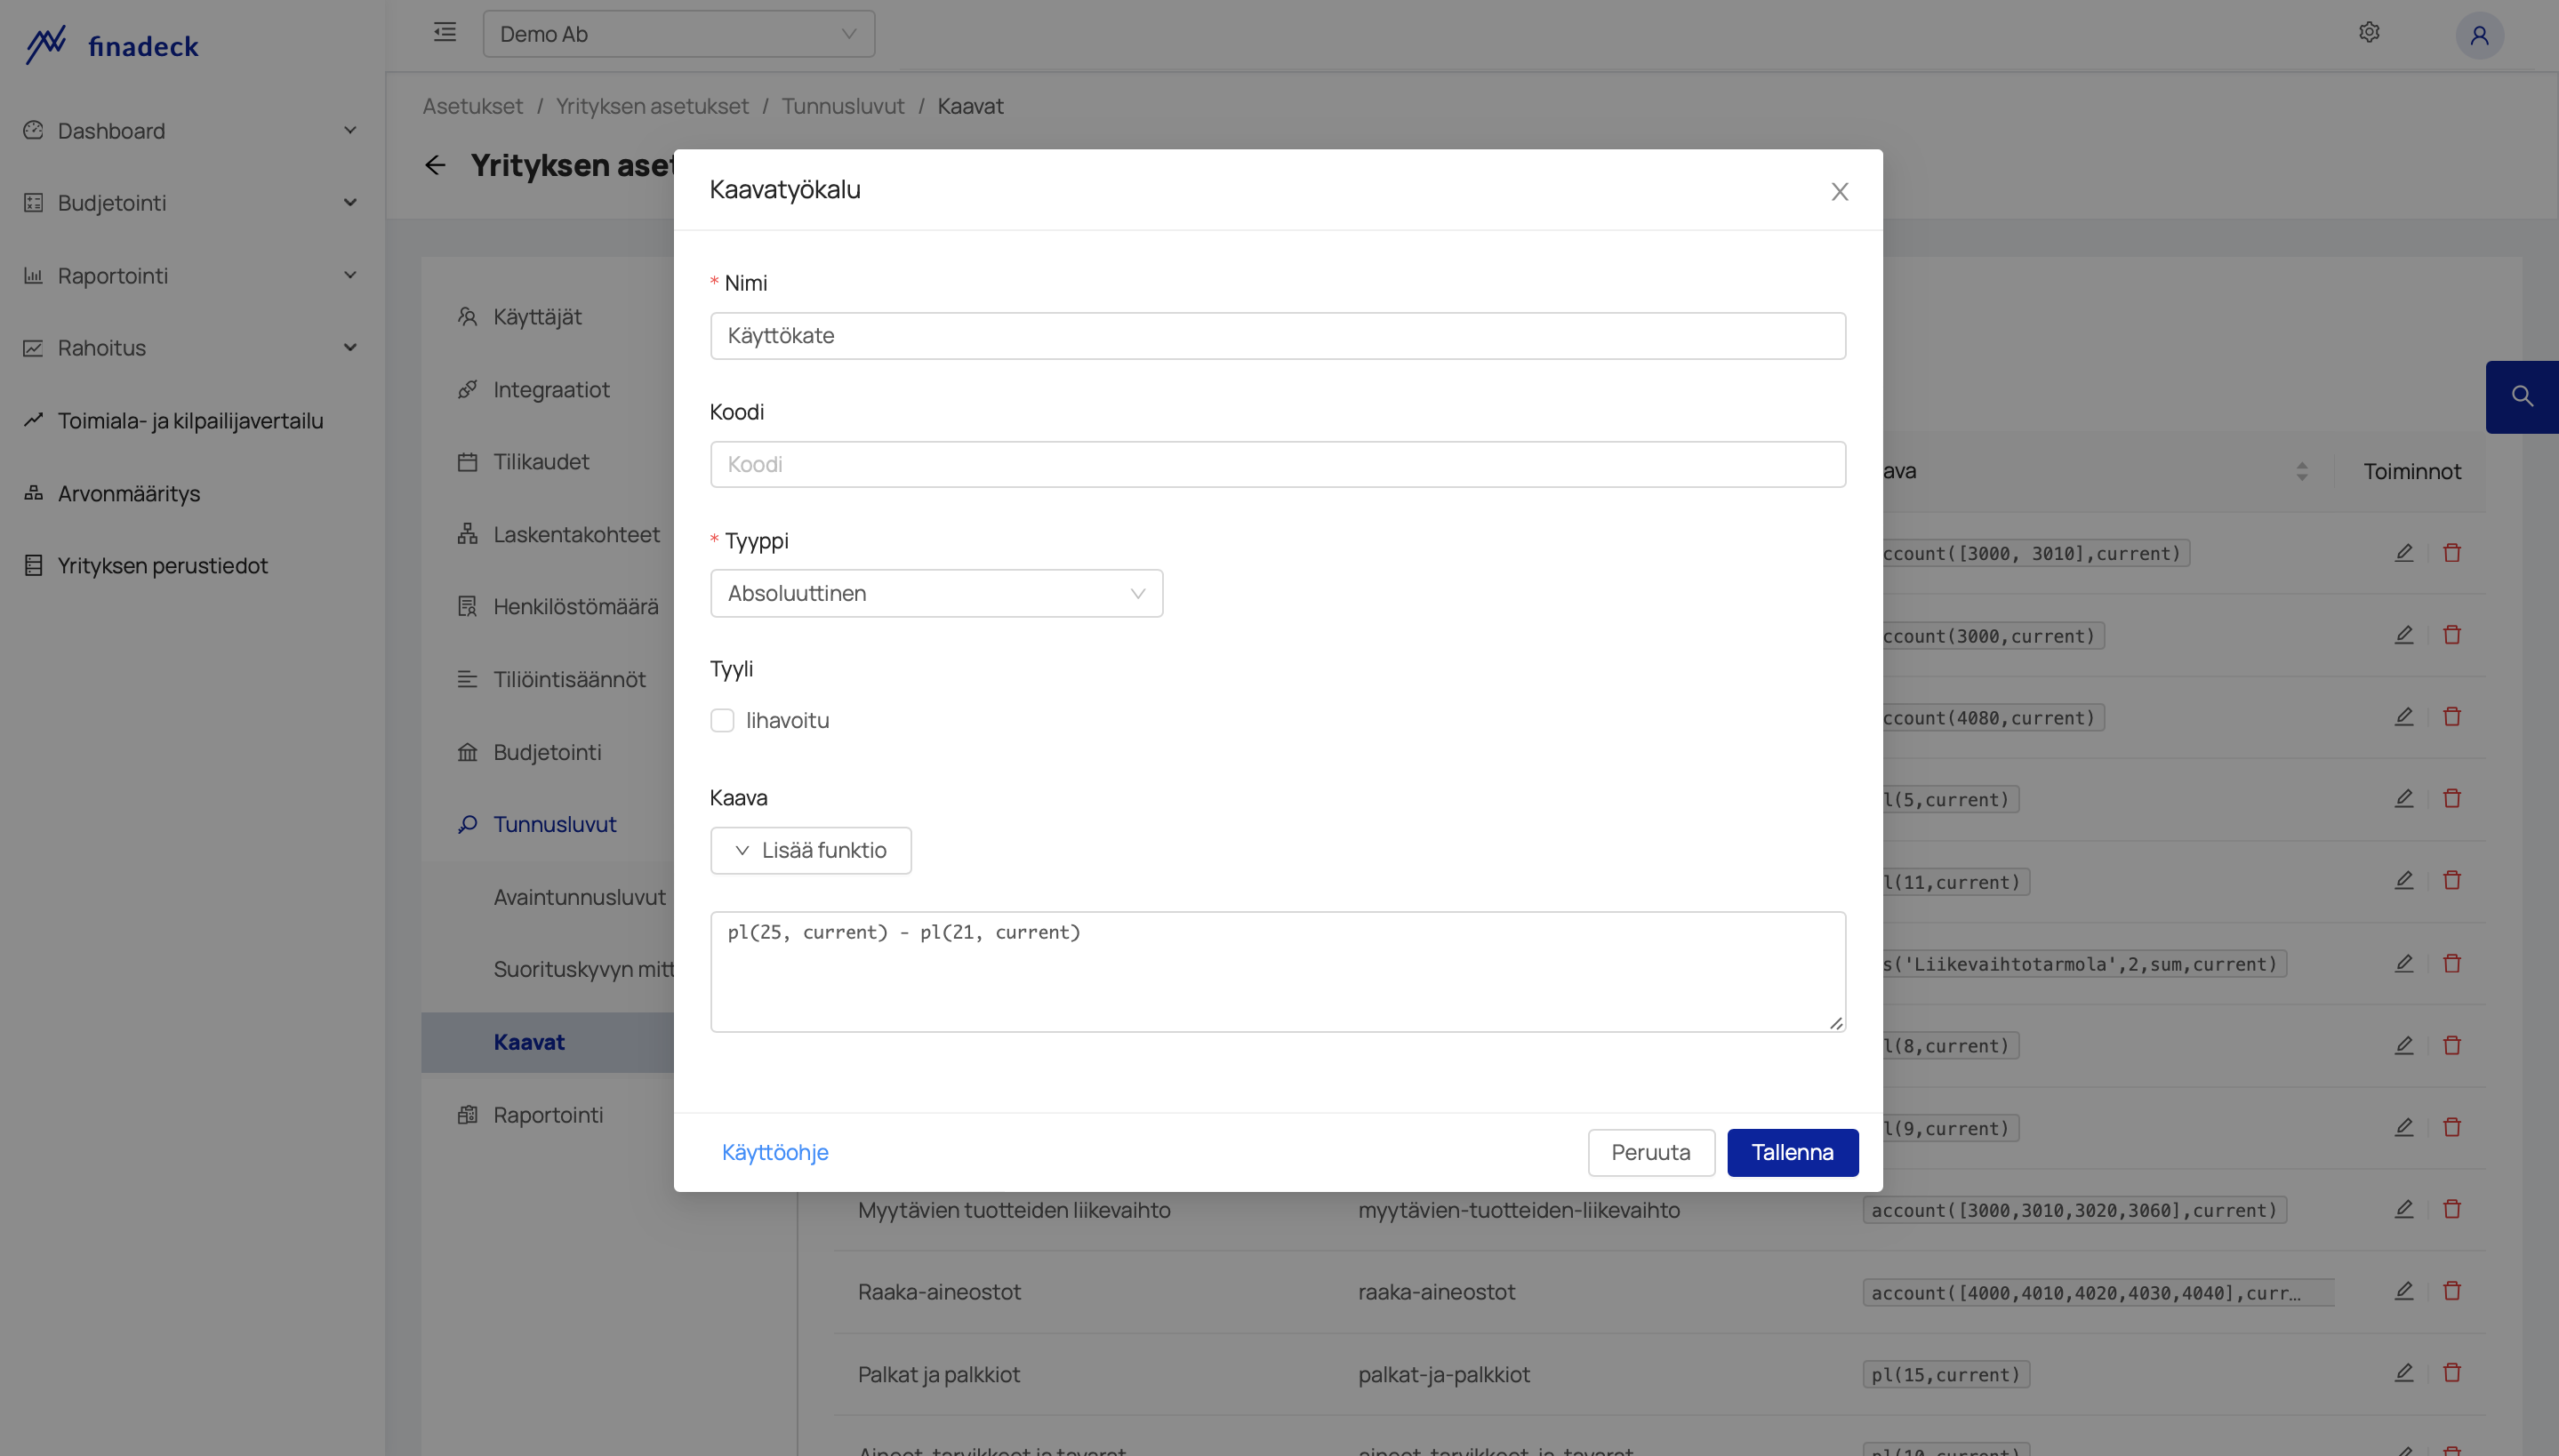
- Formula tool for own pins construction, such as:
- internal margins
- key figures for the sale, purchases and margins of products/services
- expenses/revenue per kilometre driven or working hour or any other variable imported from Google Sheets
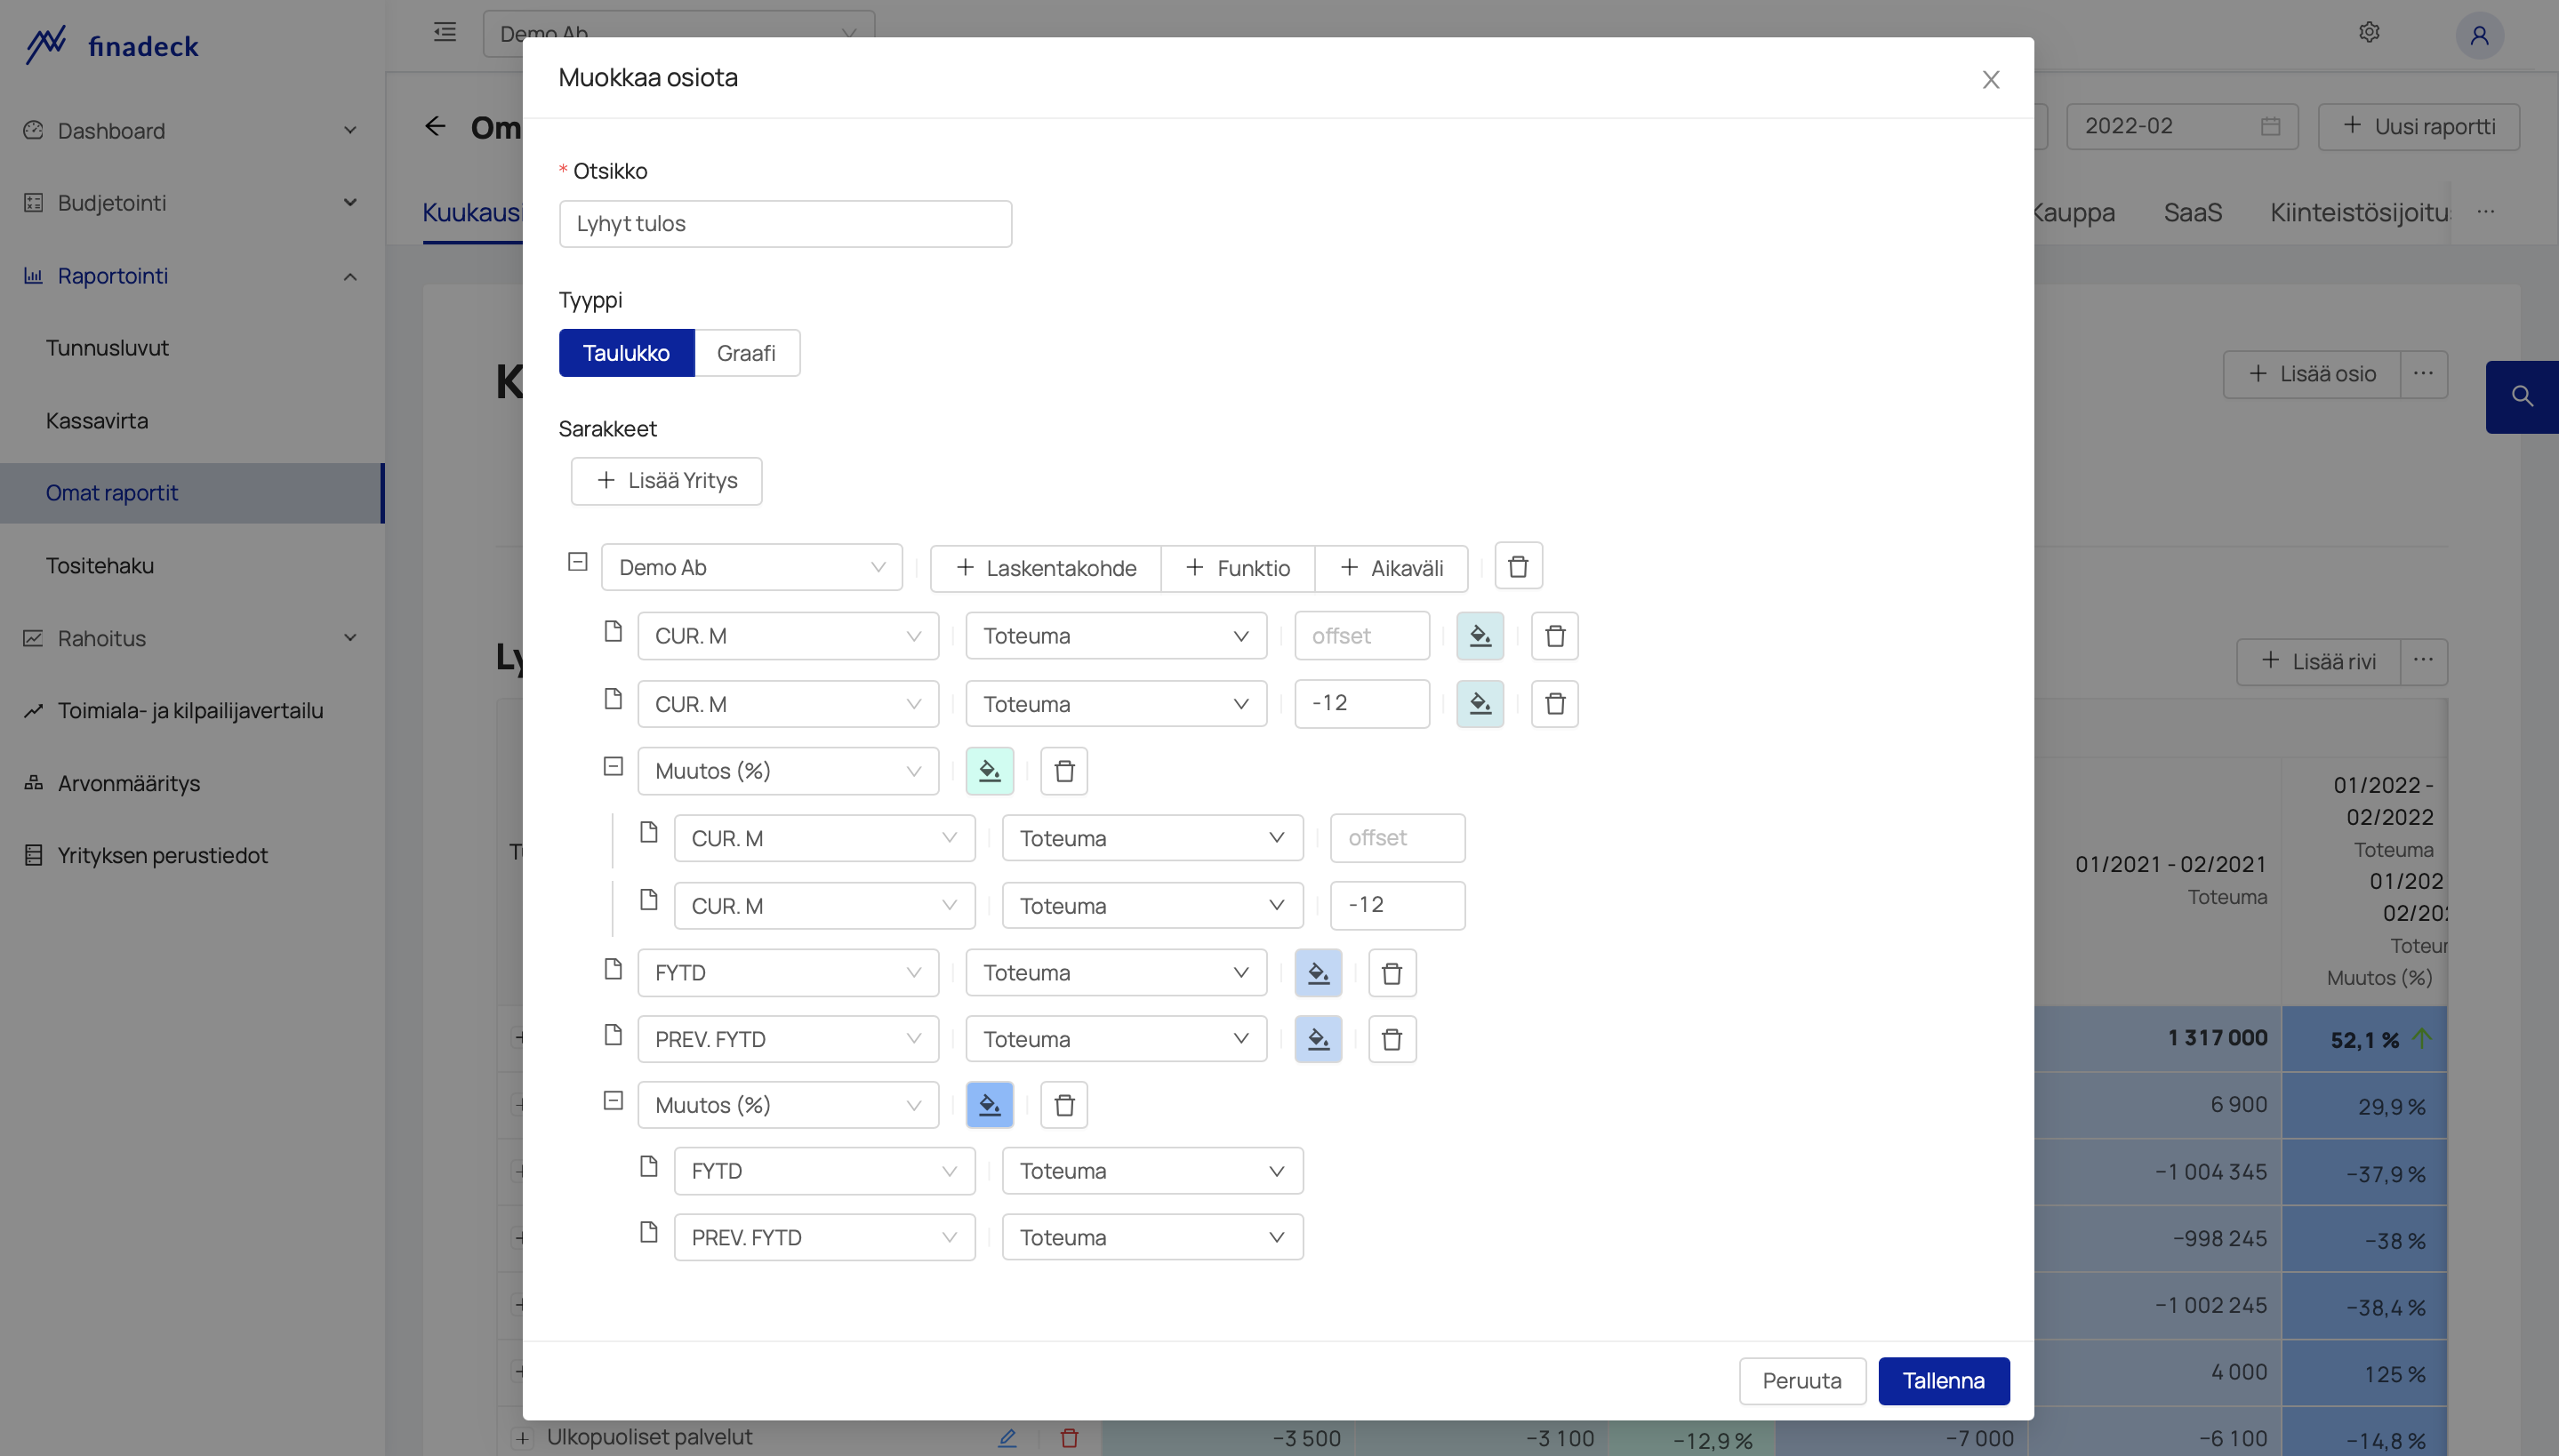
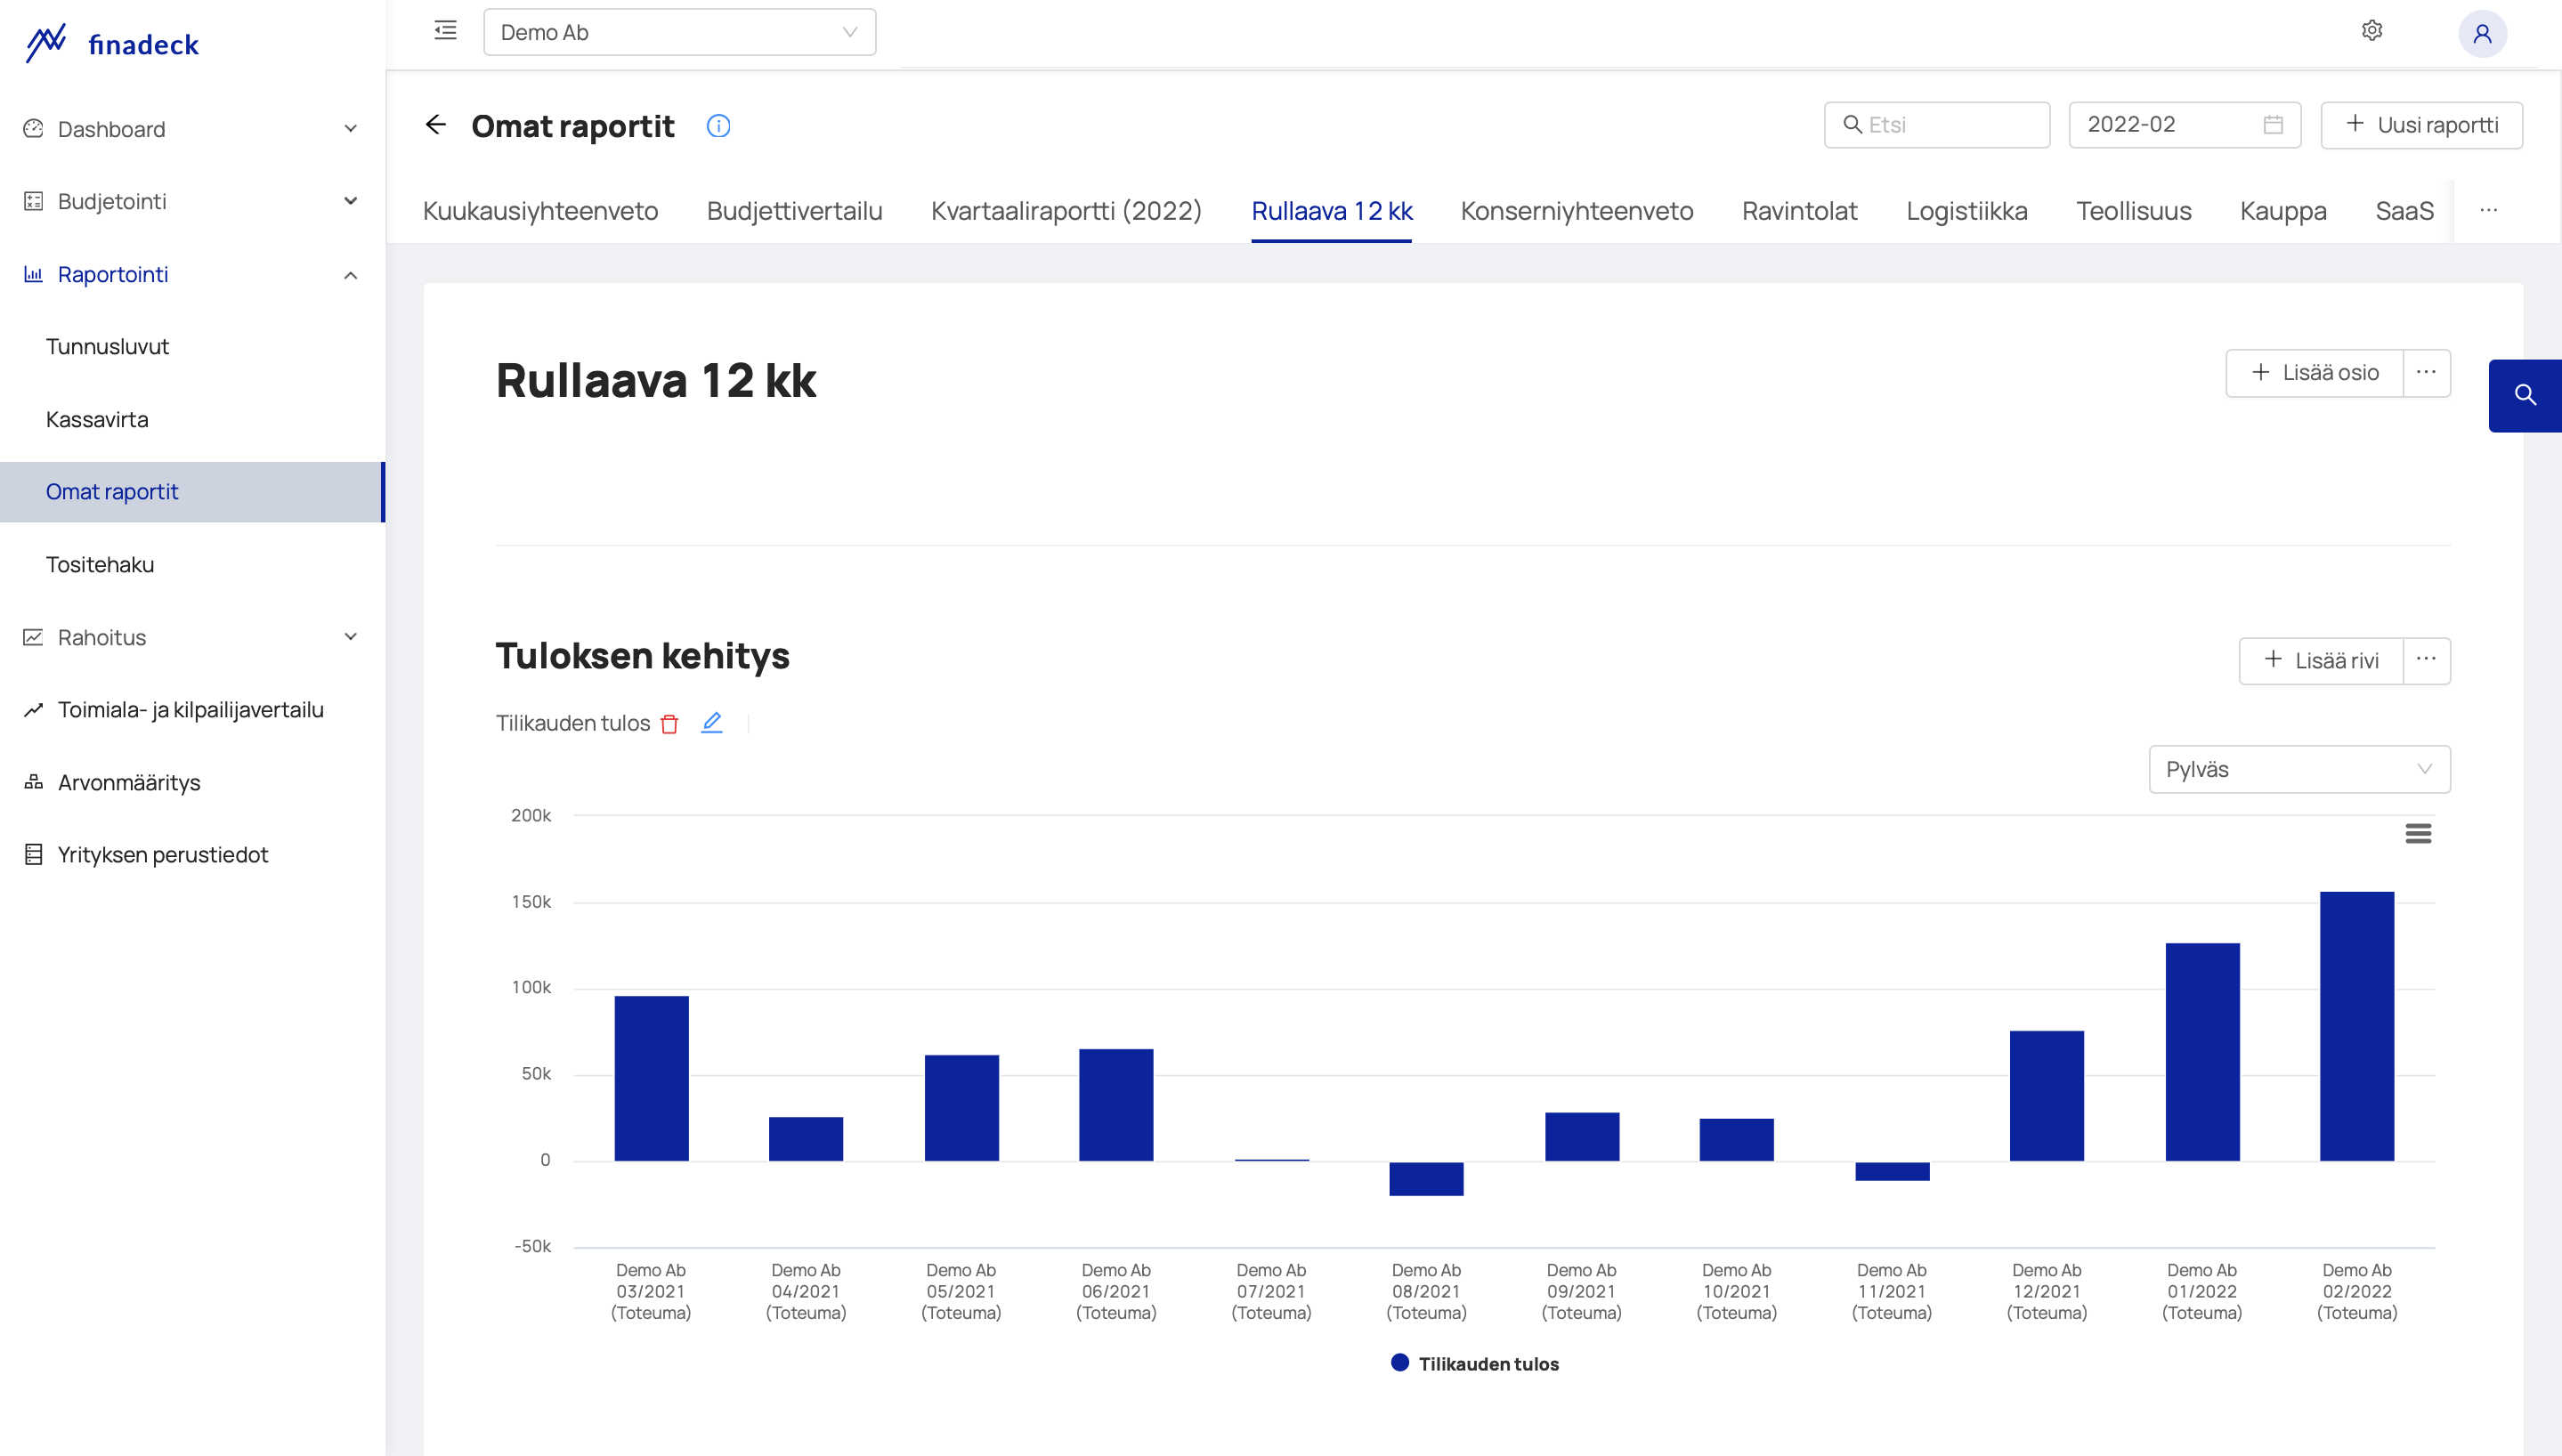
Report Building Tool
The report's building tool and its own reports section are designed for building and monitoring management and government report frames.
You can use the report builder to select the desired companies and/or calculation items, intervals, data types, and calculation functions for the columns you want, and the key figures you want for tables and graphs, and to complete the visual appearance of your reports.
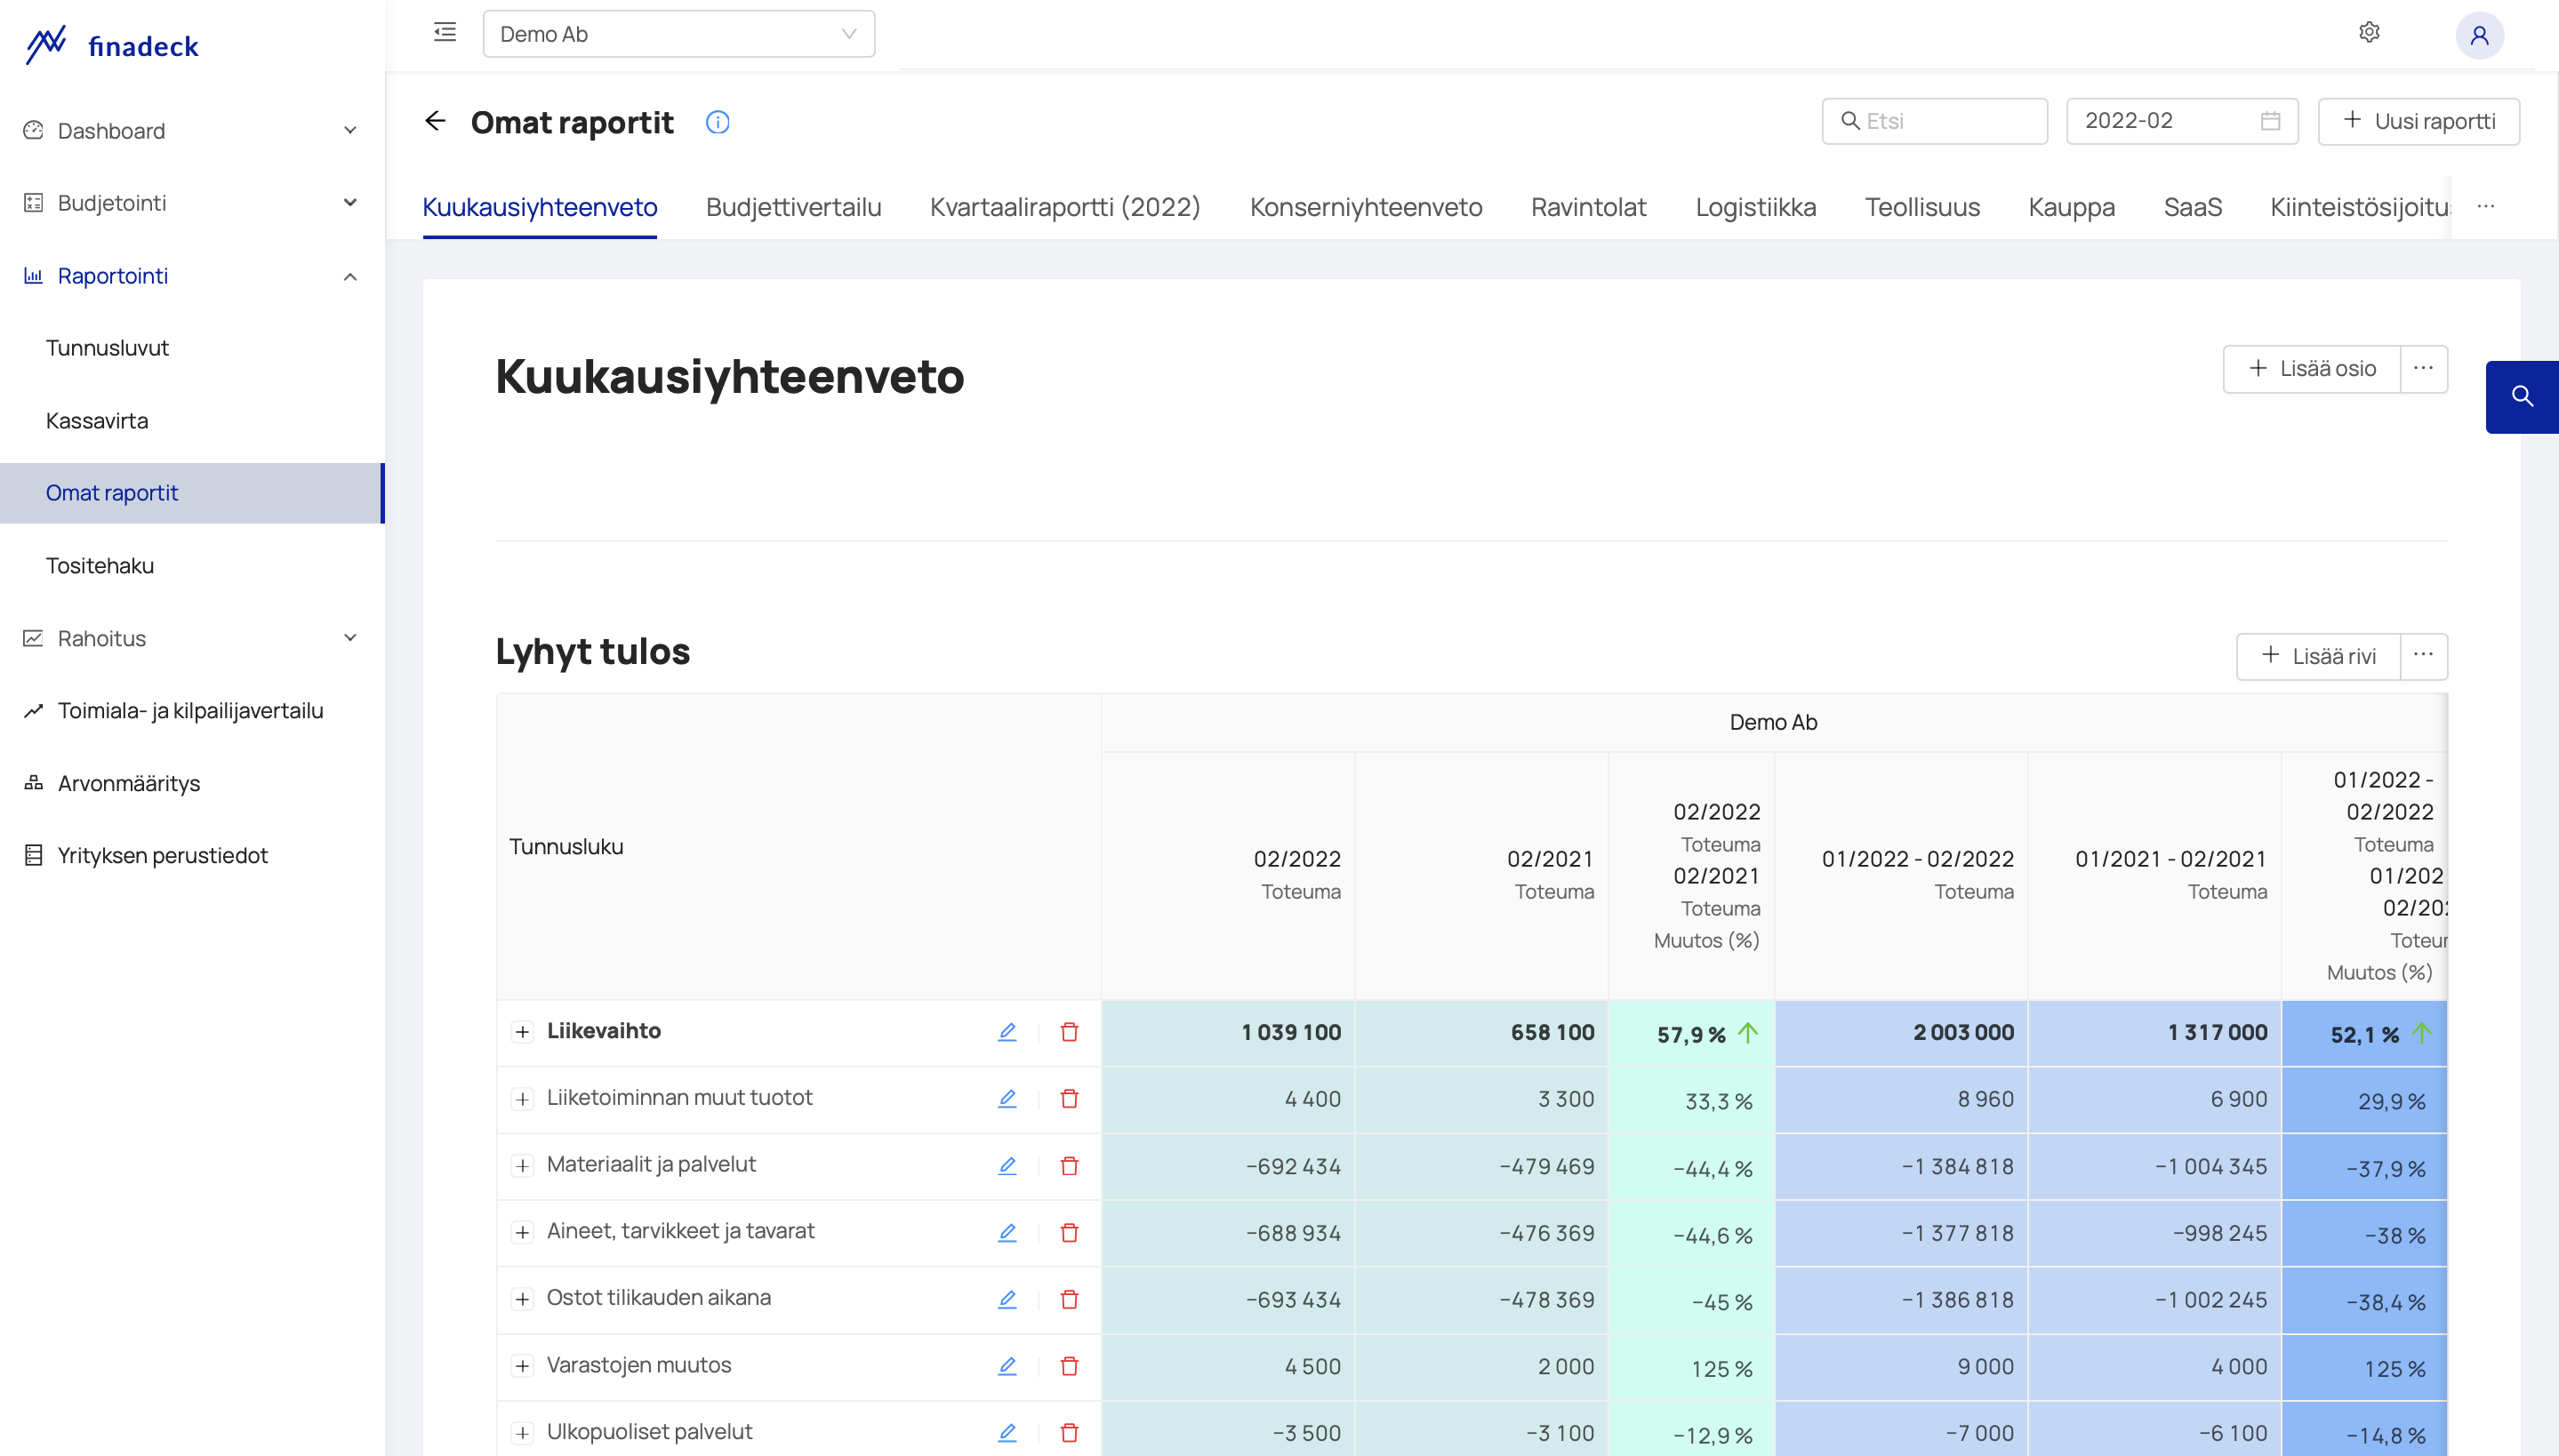
The report's building tool is ideal for building and monitoring the reports mentioned below, among other things.
- group of companies/group monthly summary reports
- company/association monthly summary reports
- monthly summary reports for company/association calculation items, such as different projects, offices or vehicles
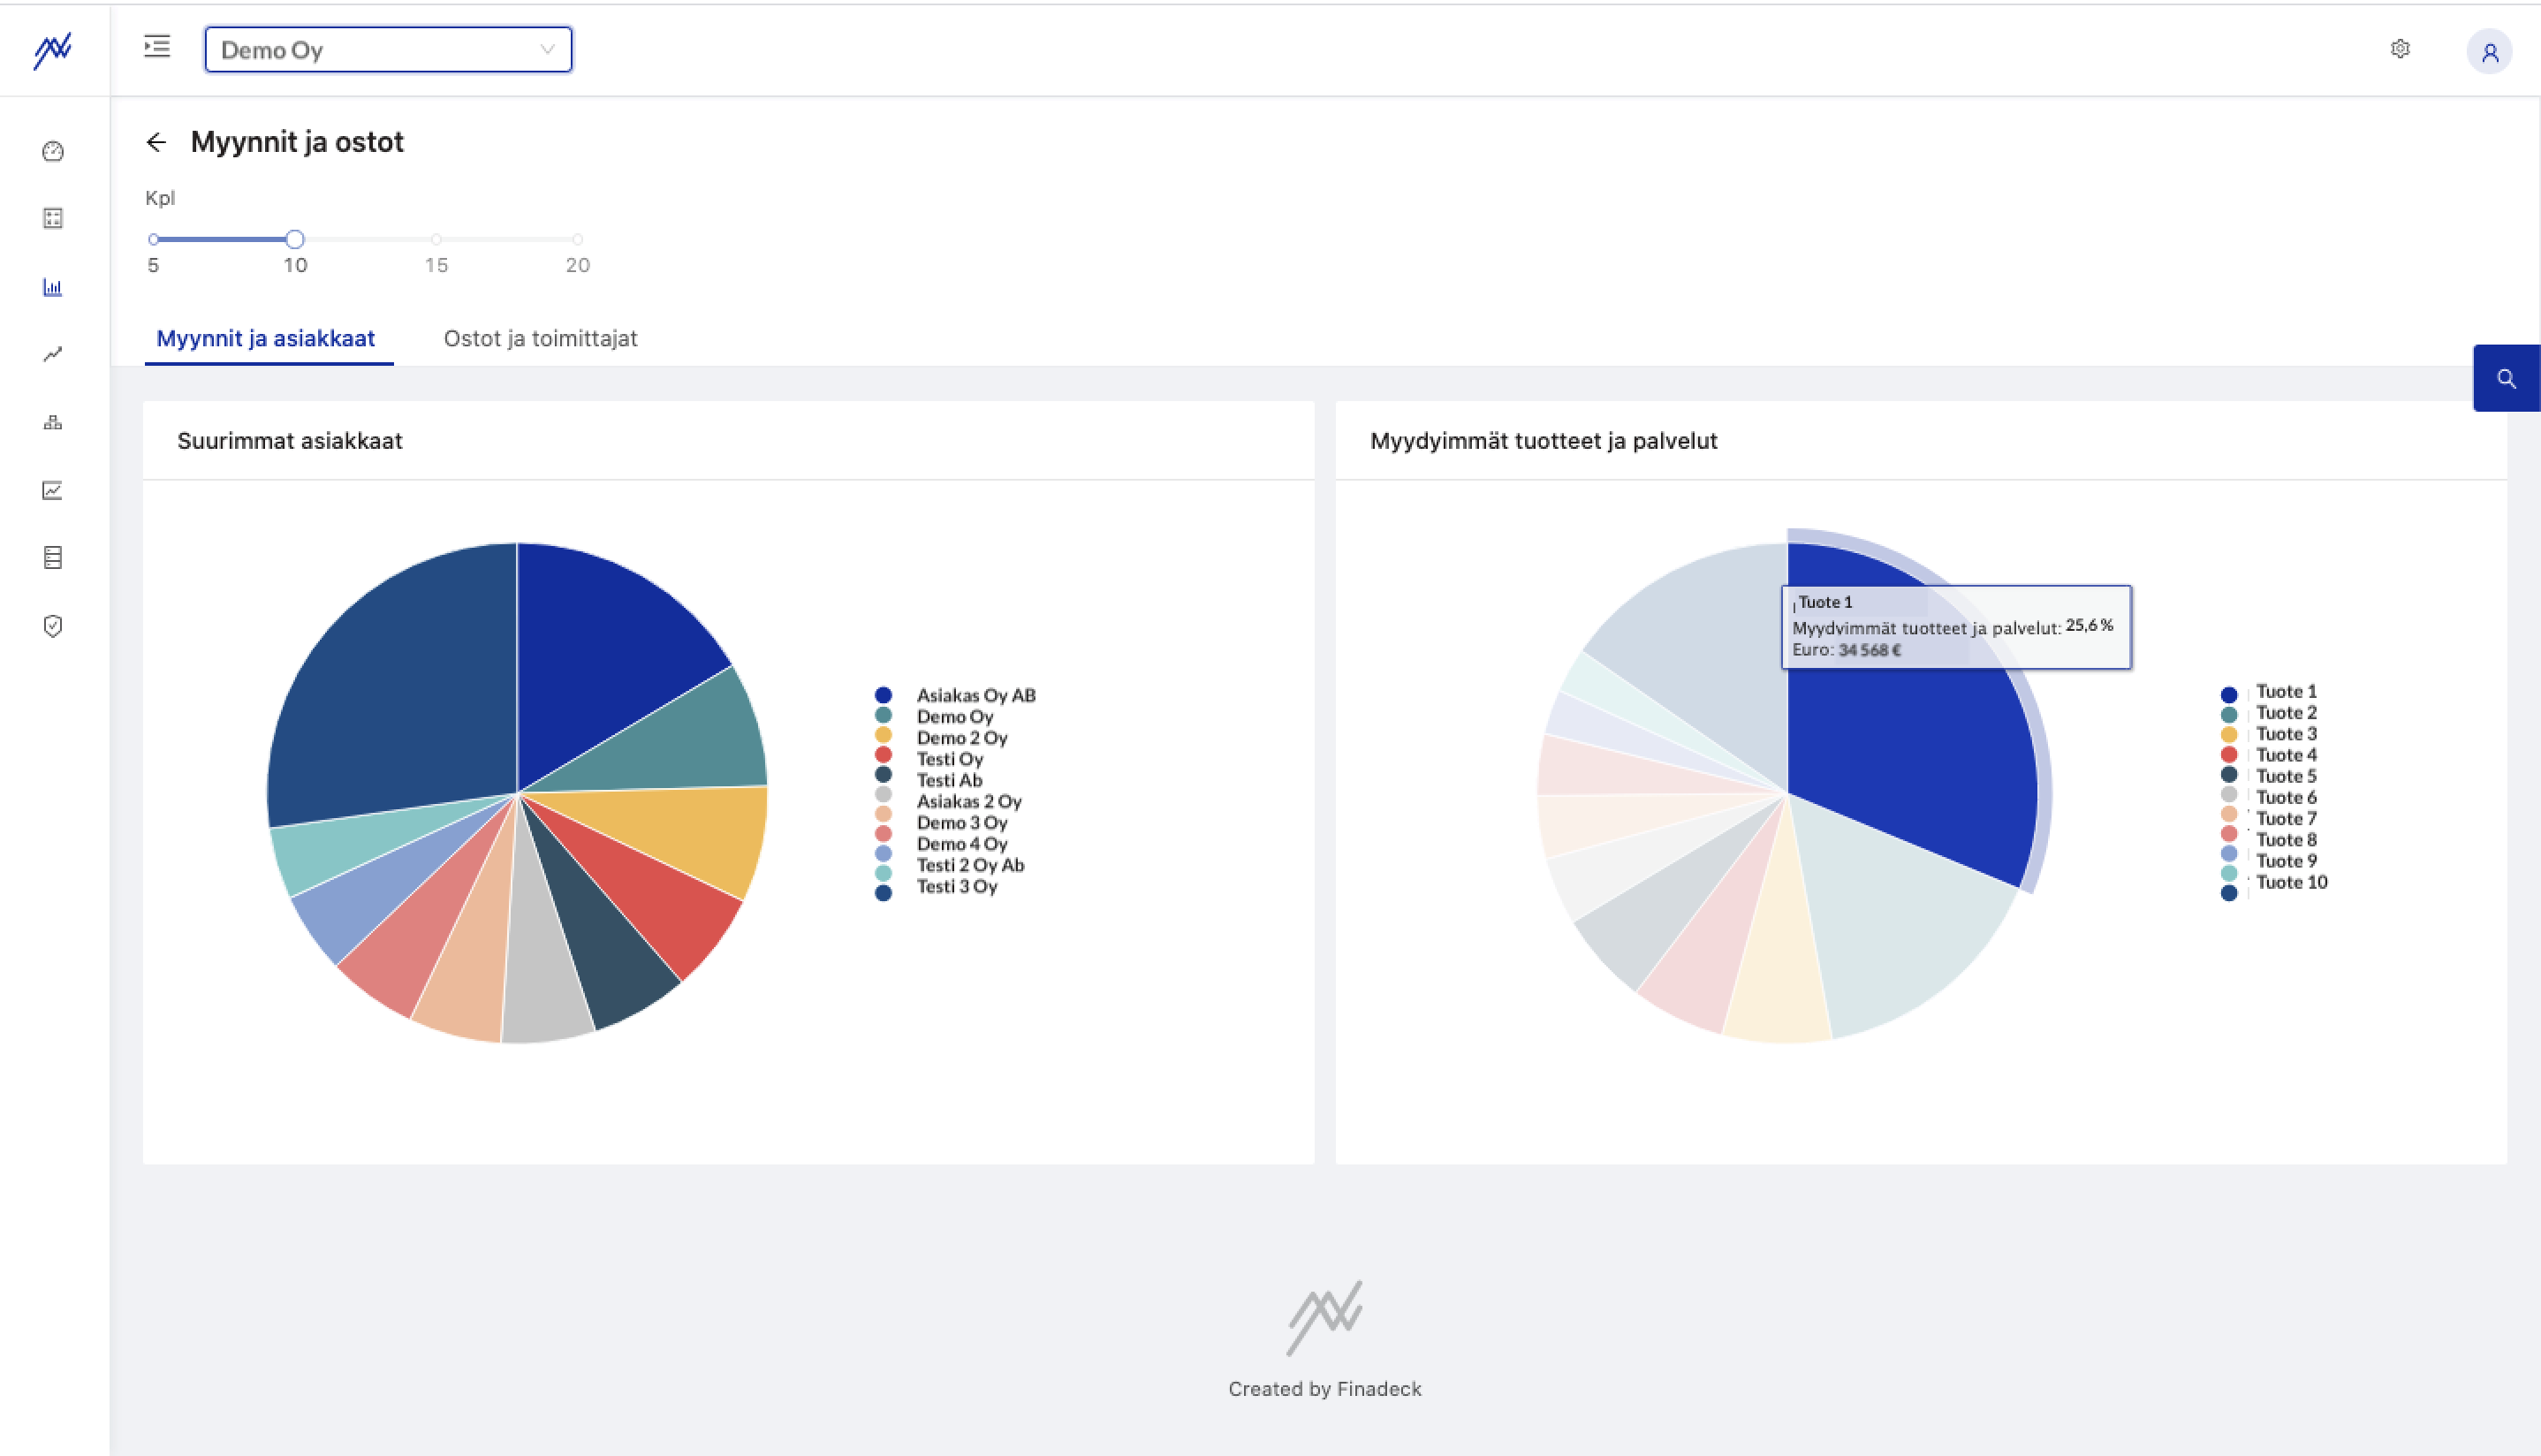
Sales reporting
- largest customers
- best-selling products
- largest suppliers
- the most purchased products
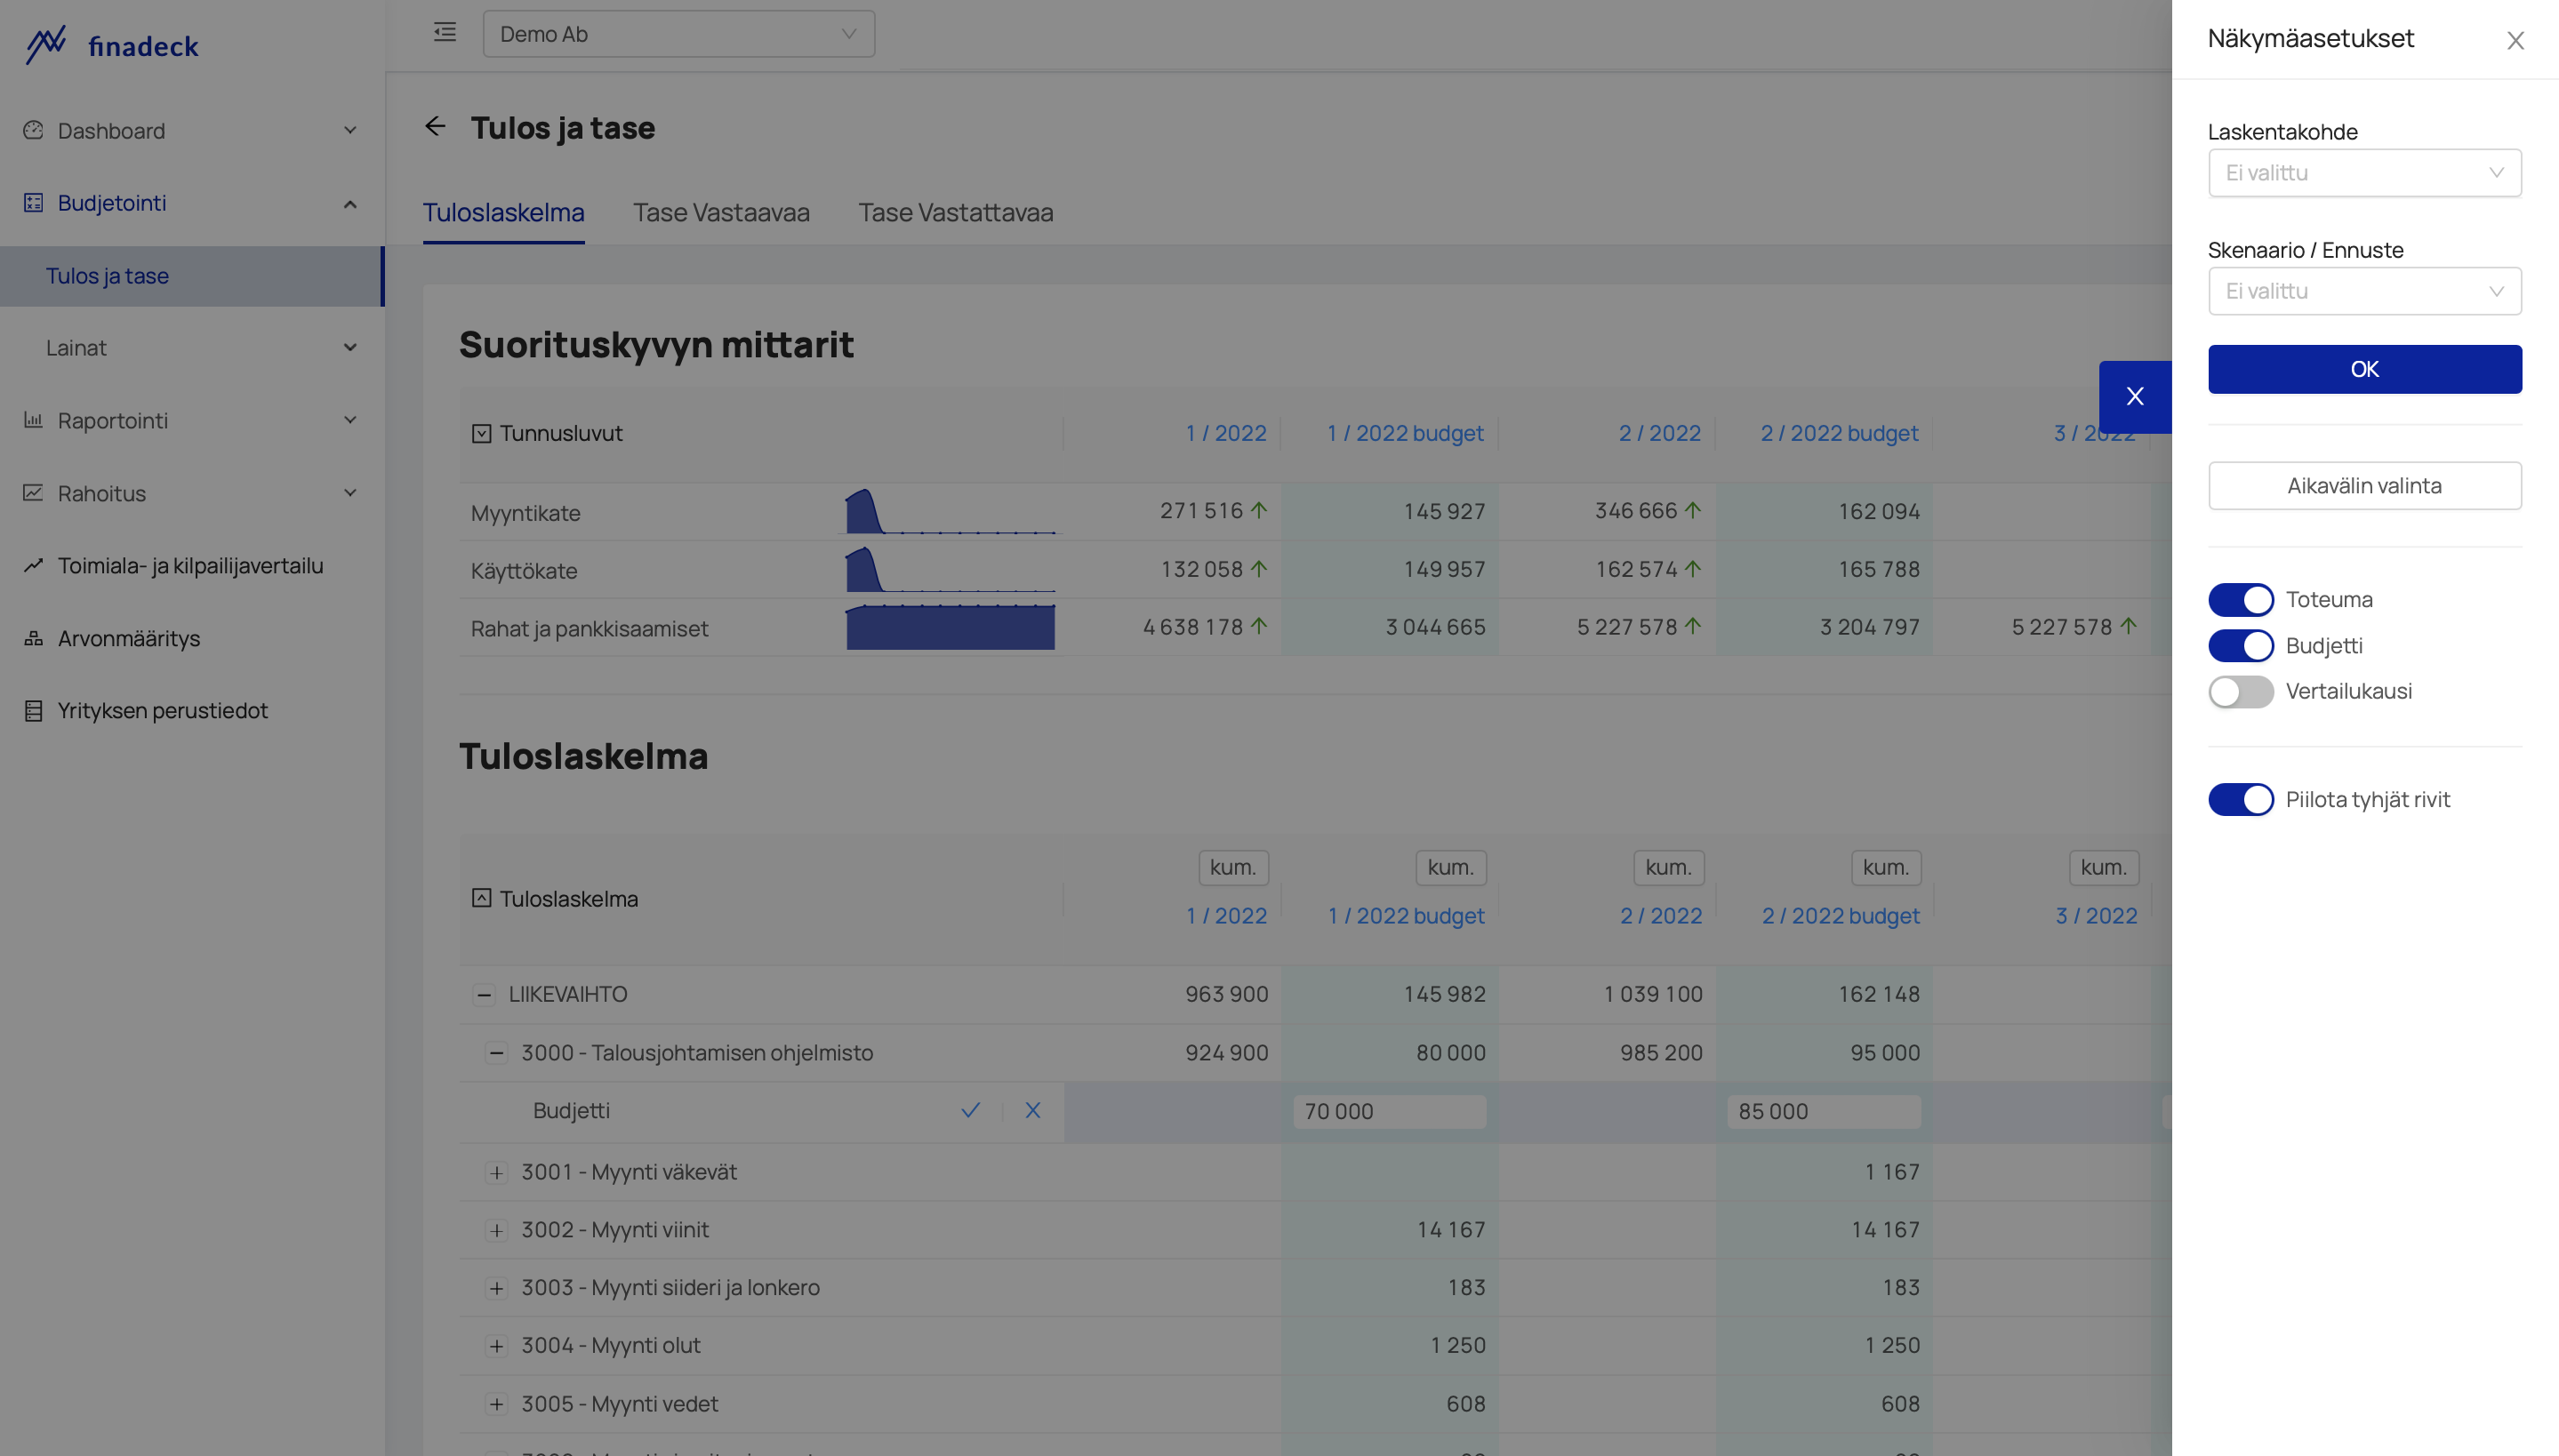
Budgeting and forecasting
Avoid an extra headache in calculating and reporting by directing resources to enter and track forecasts.
By creating scenarios and forecasts, you can compare how well you have achieved your financial goals compared to the scenarios and forecasts you have created.
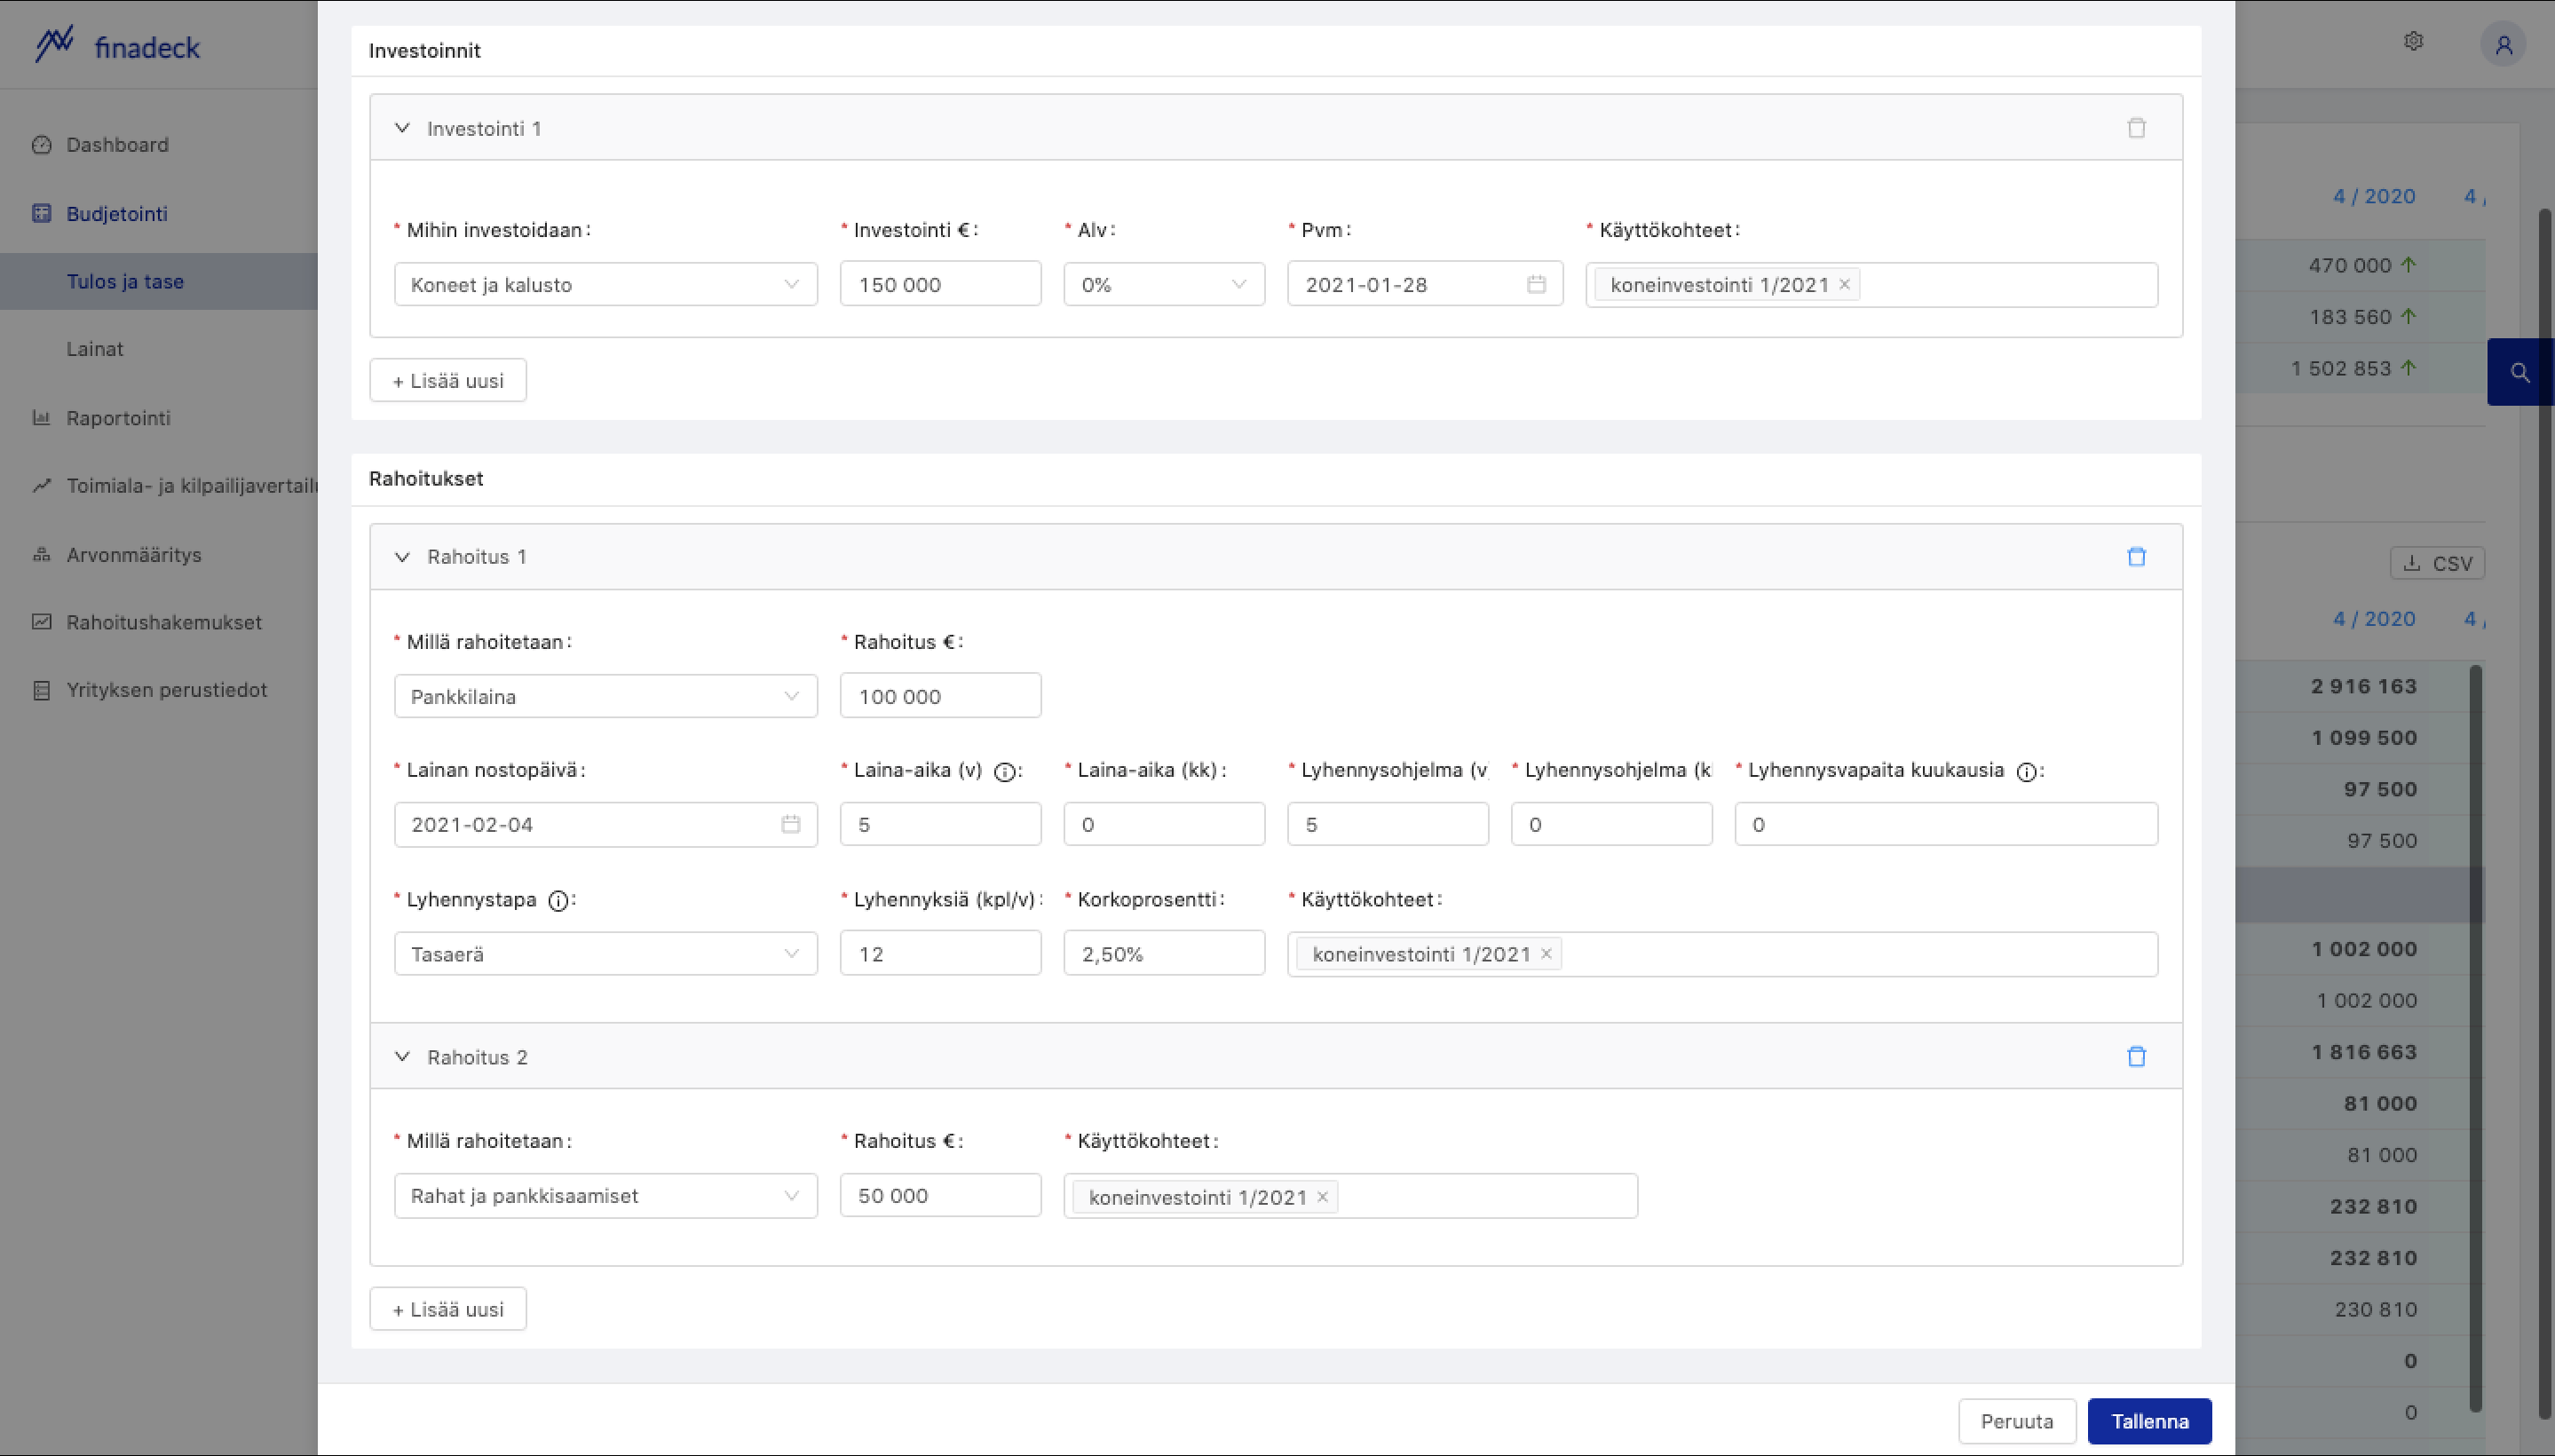
When planning investments, you can choose debt and equity financing options as sources of funding and easily see if budgeted cash flows will be sufficient to repay liabilities.
Finadeck will make sure that the budgeted balance sheet always matches.
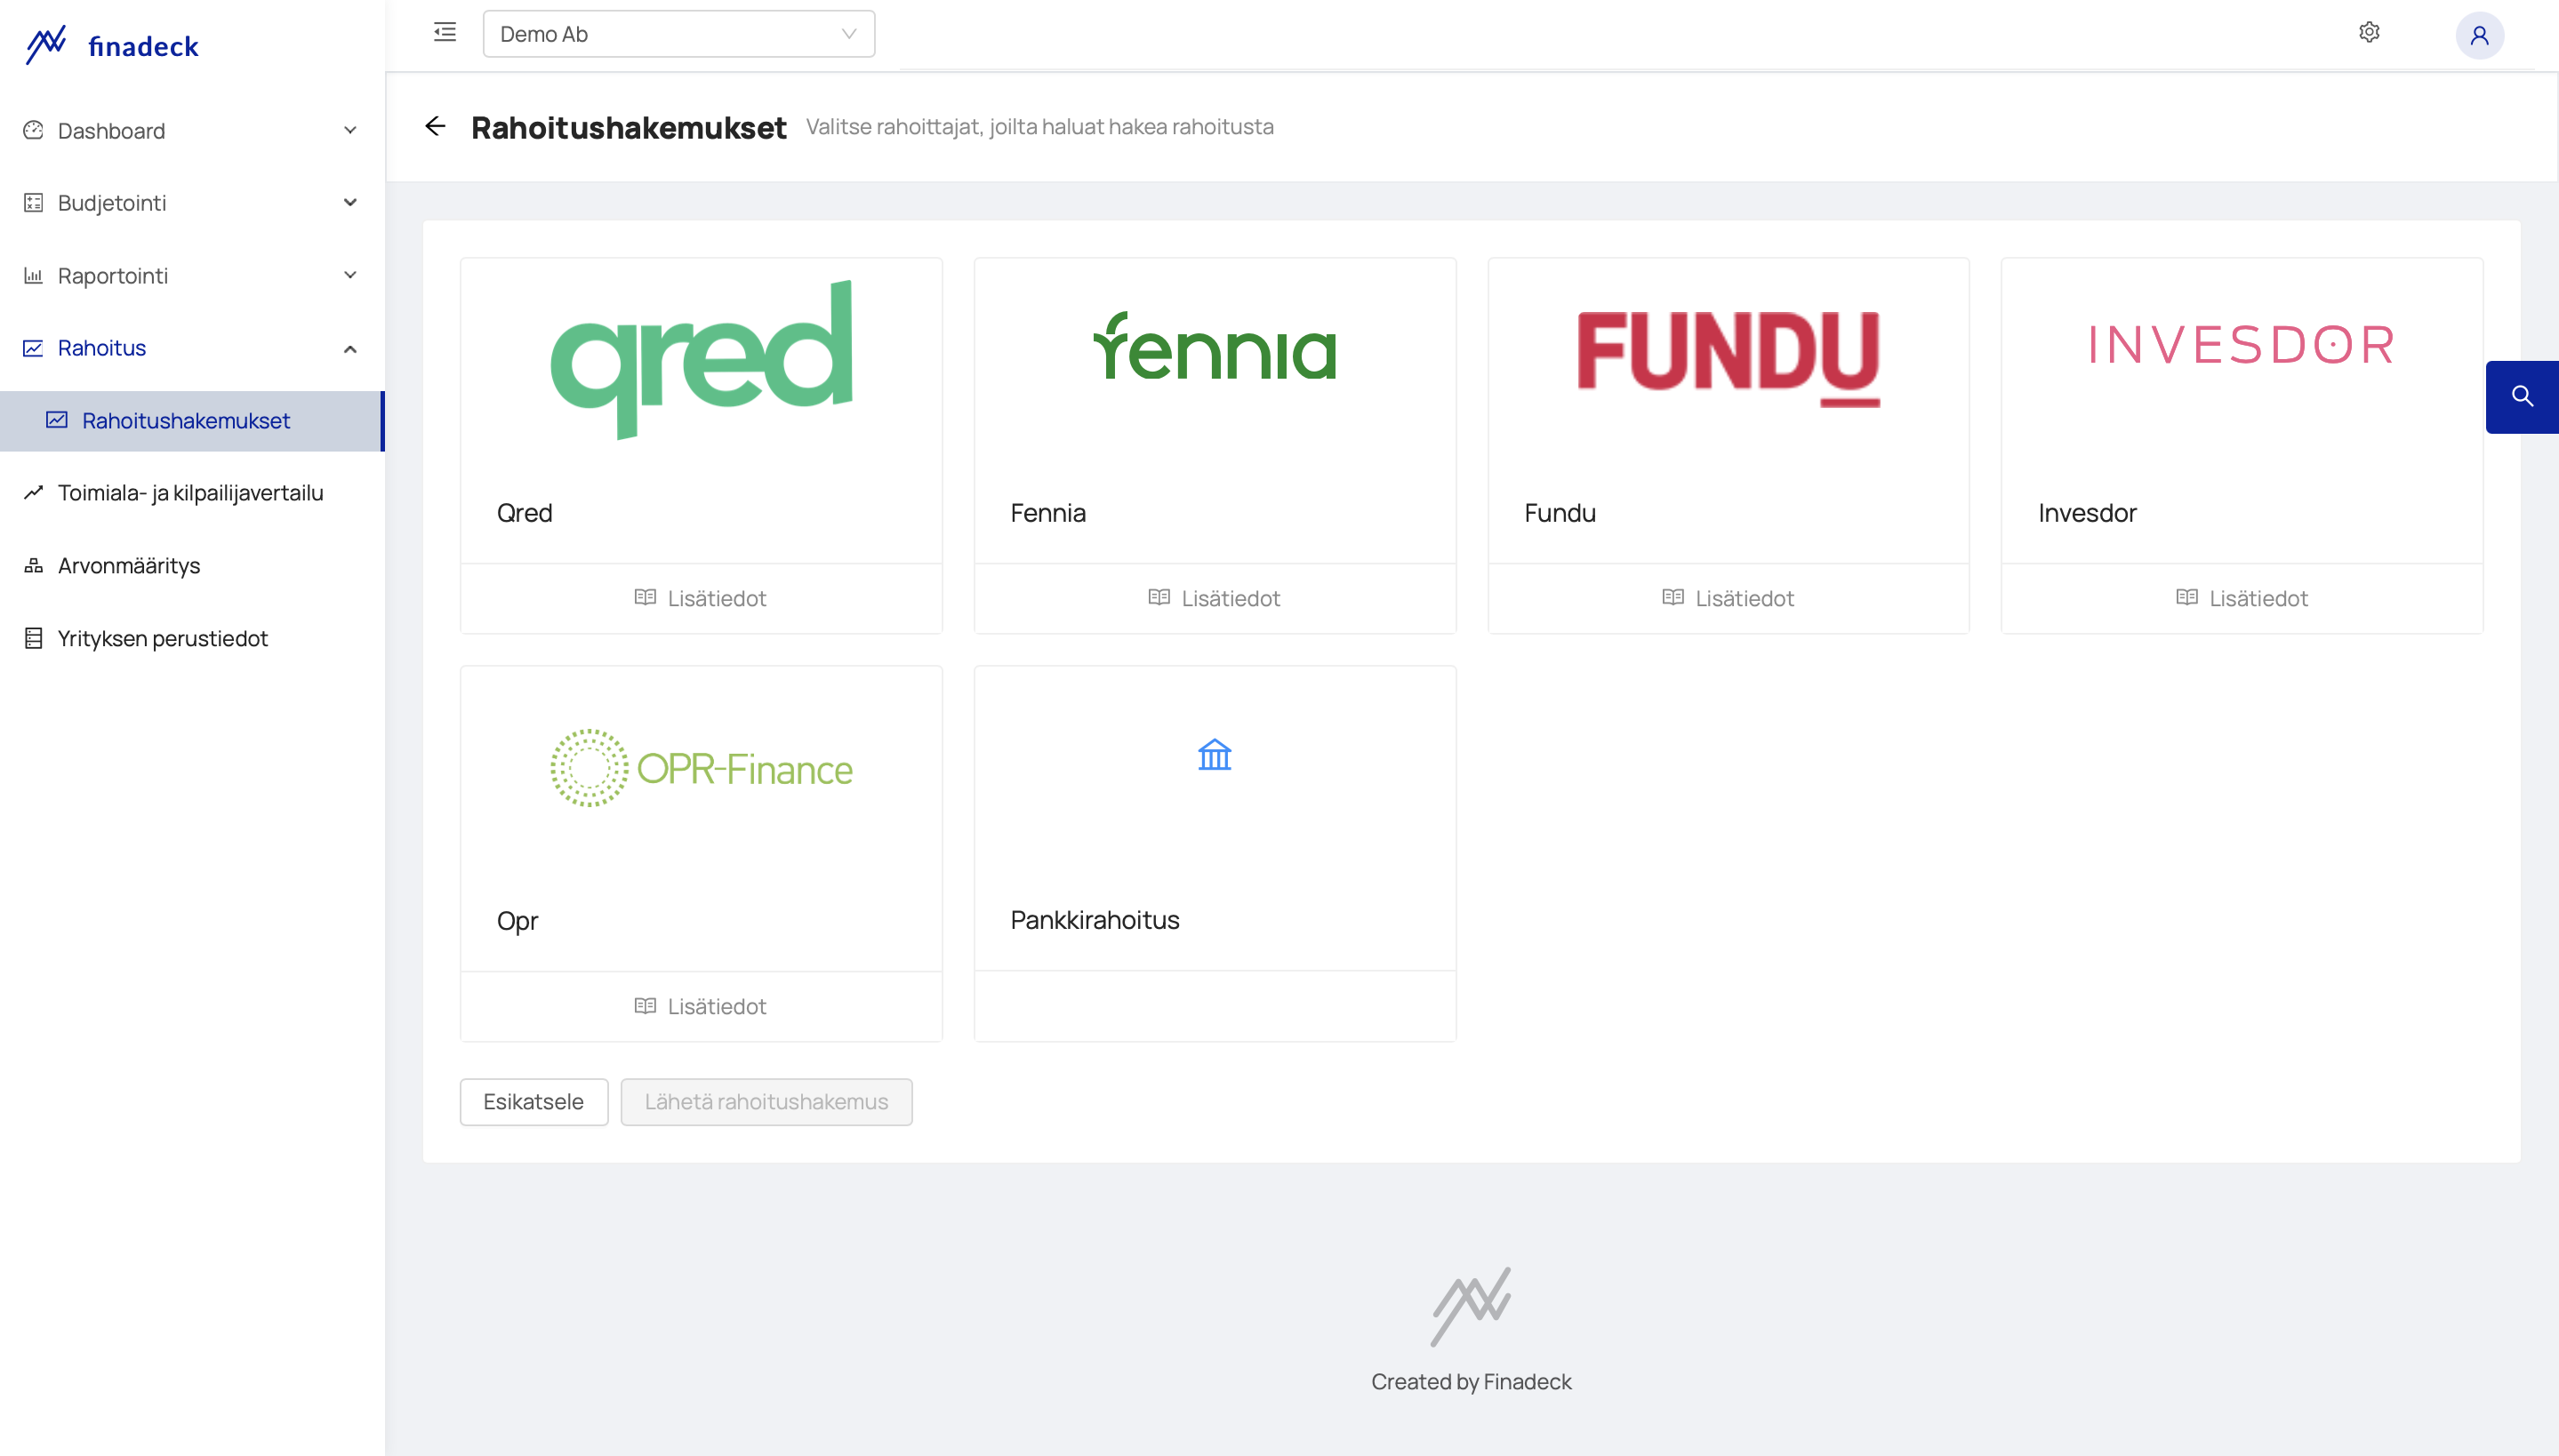
Funding search
Convince the financiers with ready-made calculations and save time in applying for funding by sending a funding application to the financiers of your choosing directly from Finadeck.
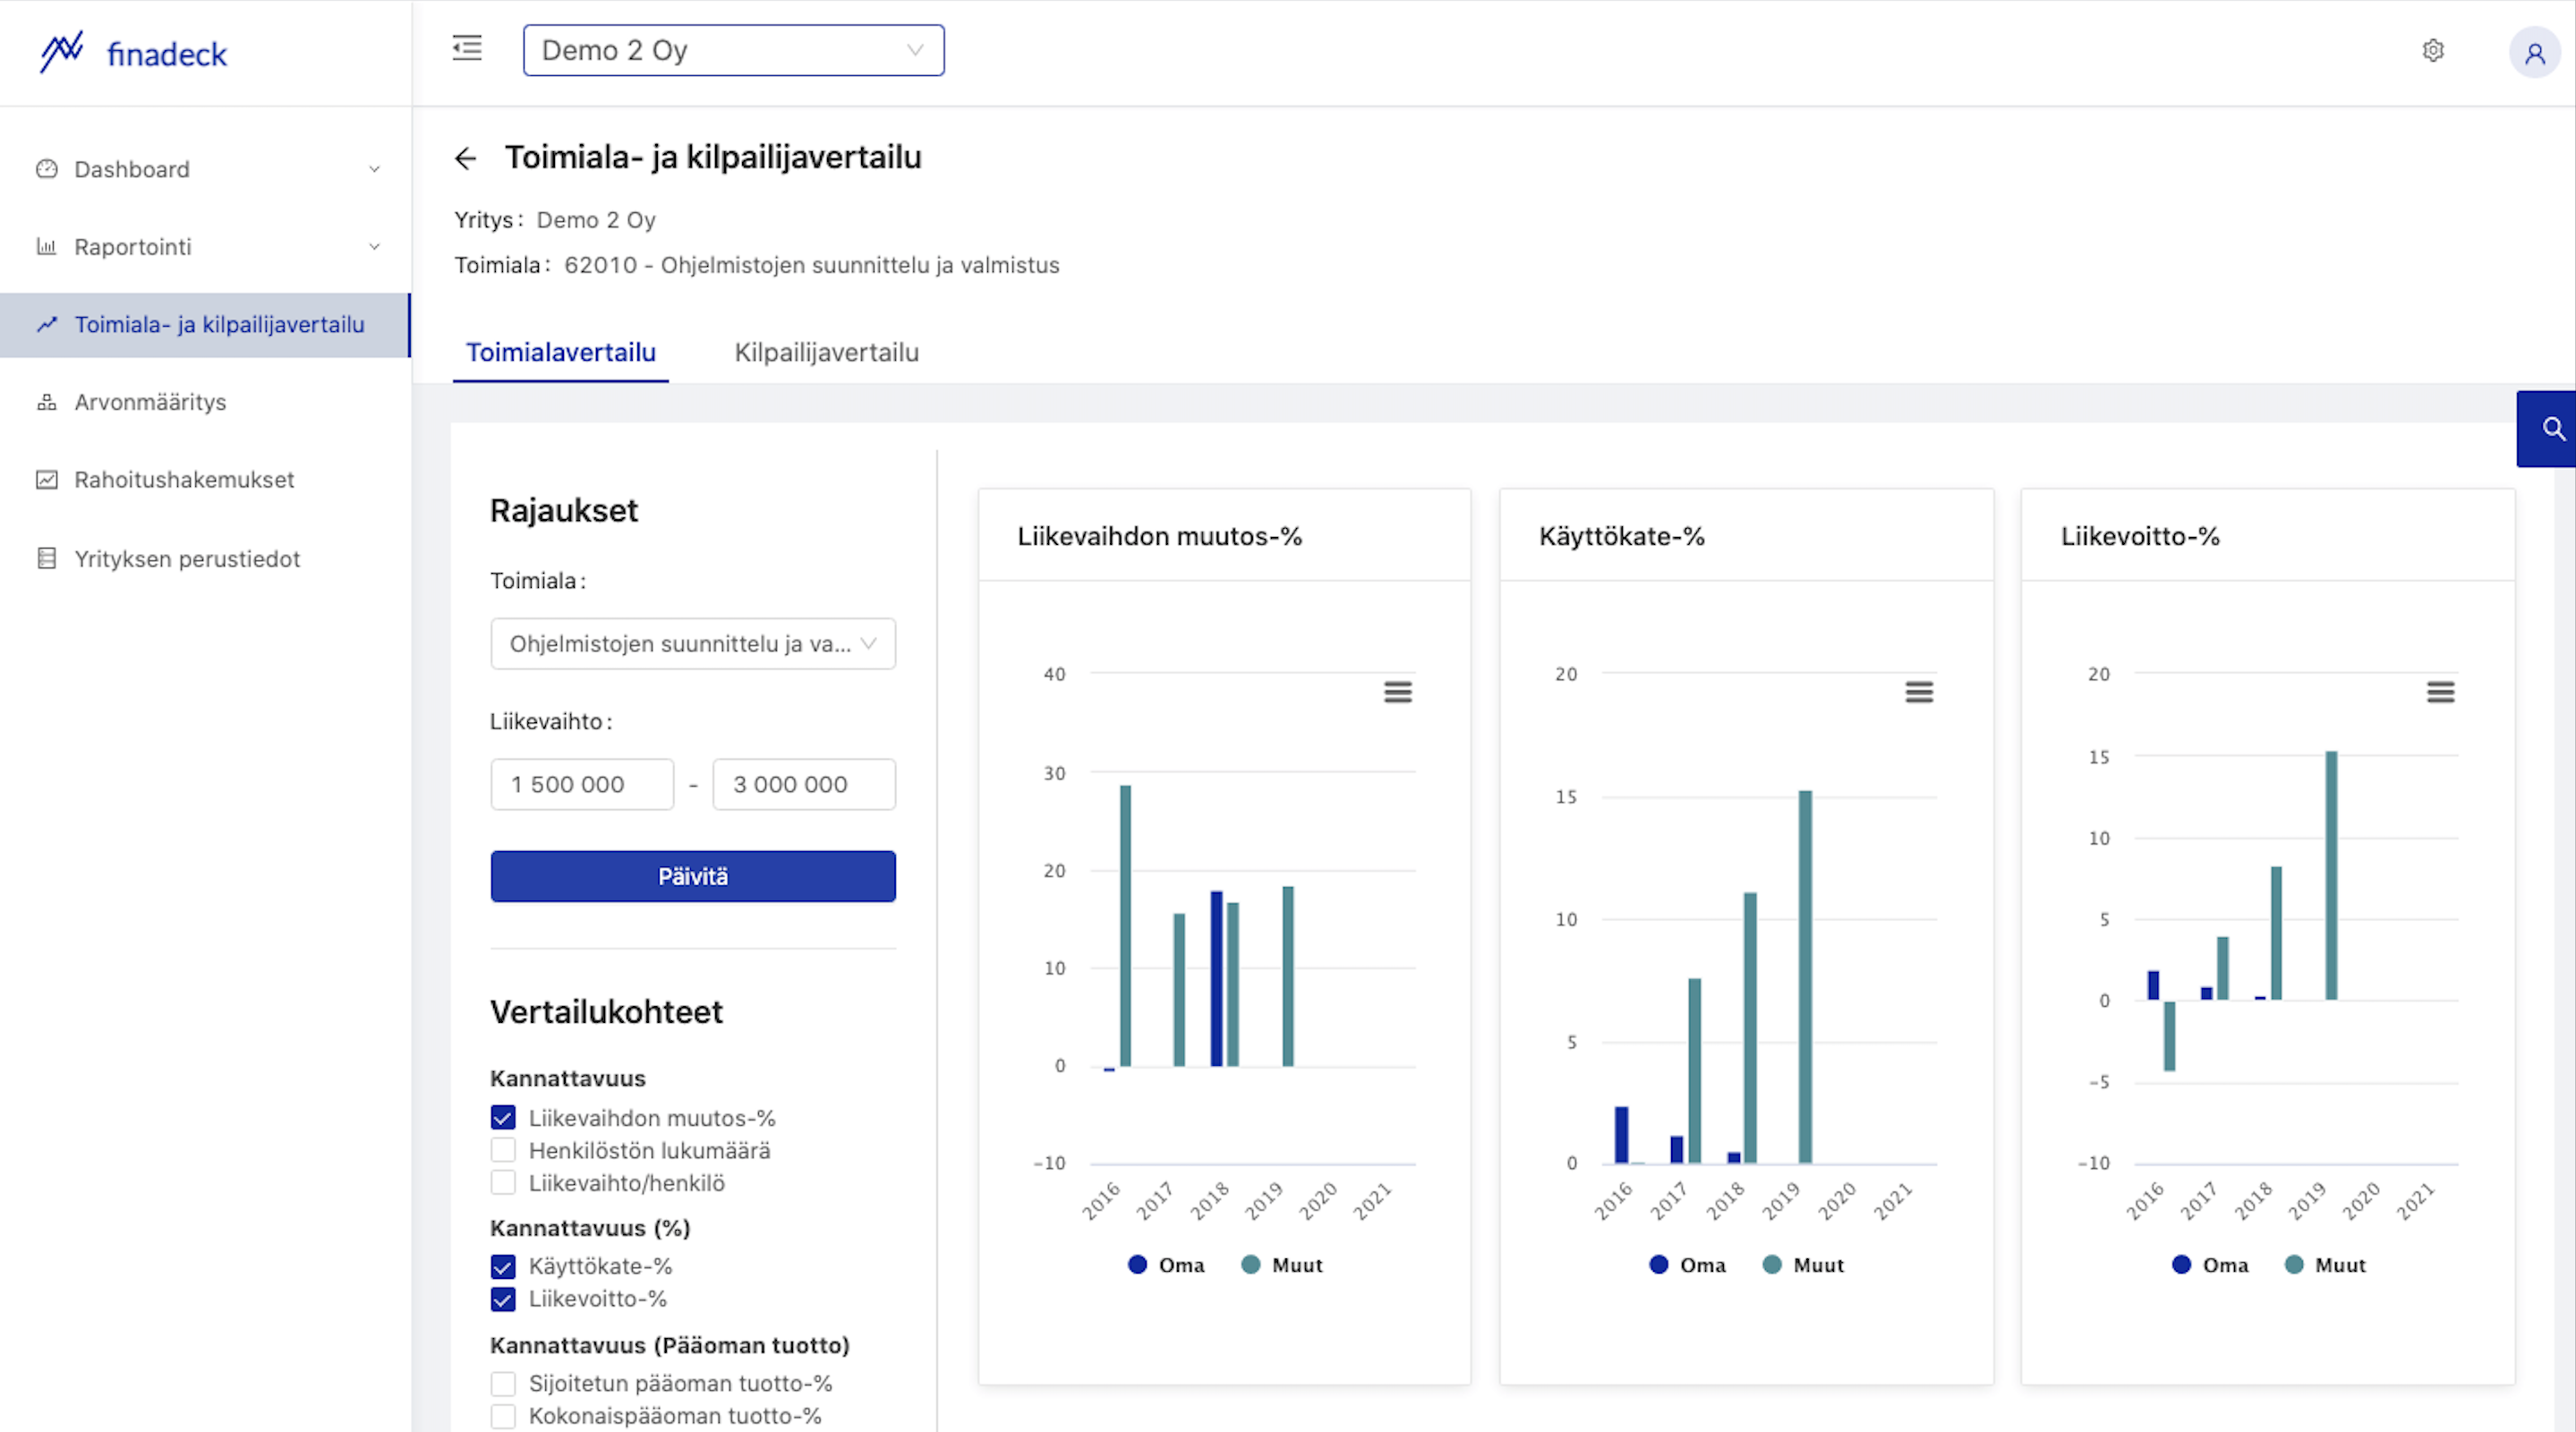
Industry and competitor comparison
Get a bigger picture by comparing your company's financial success with competitors or a group of competitors in the industry you want.
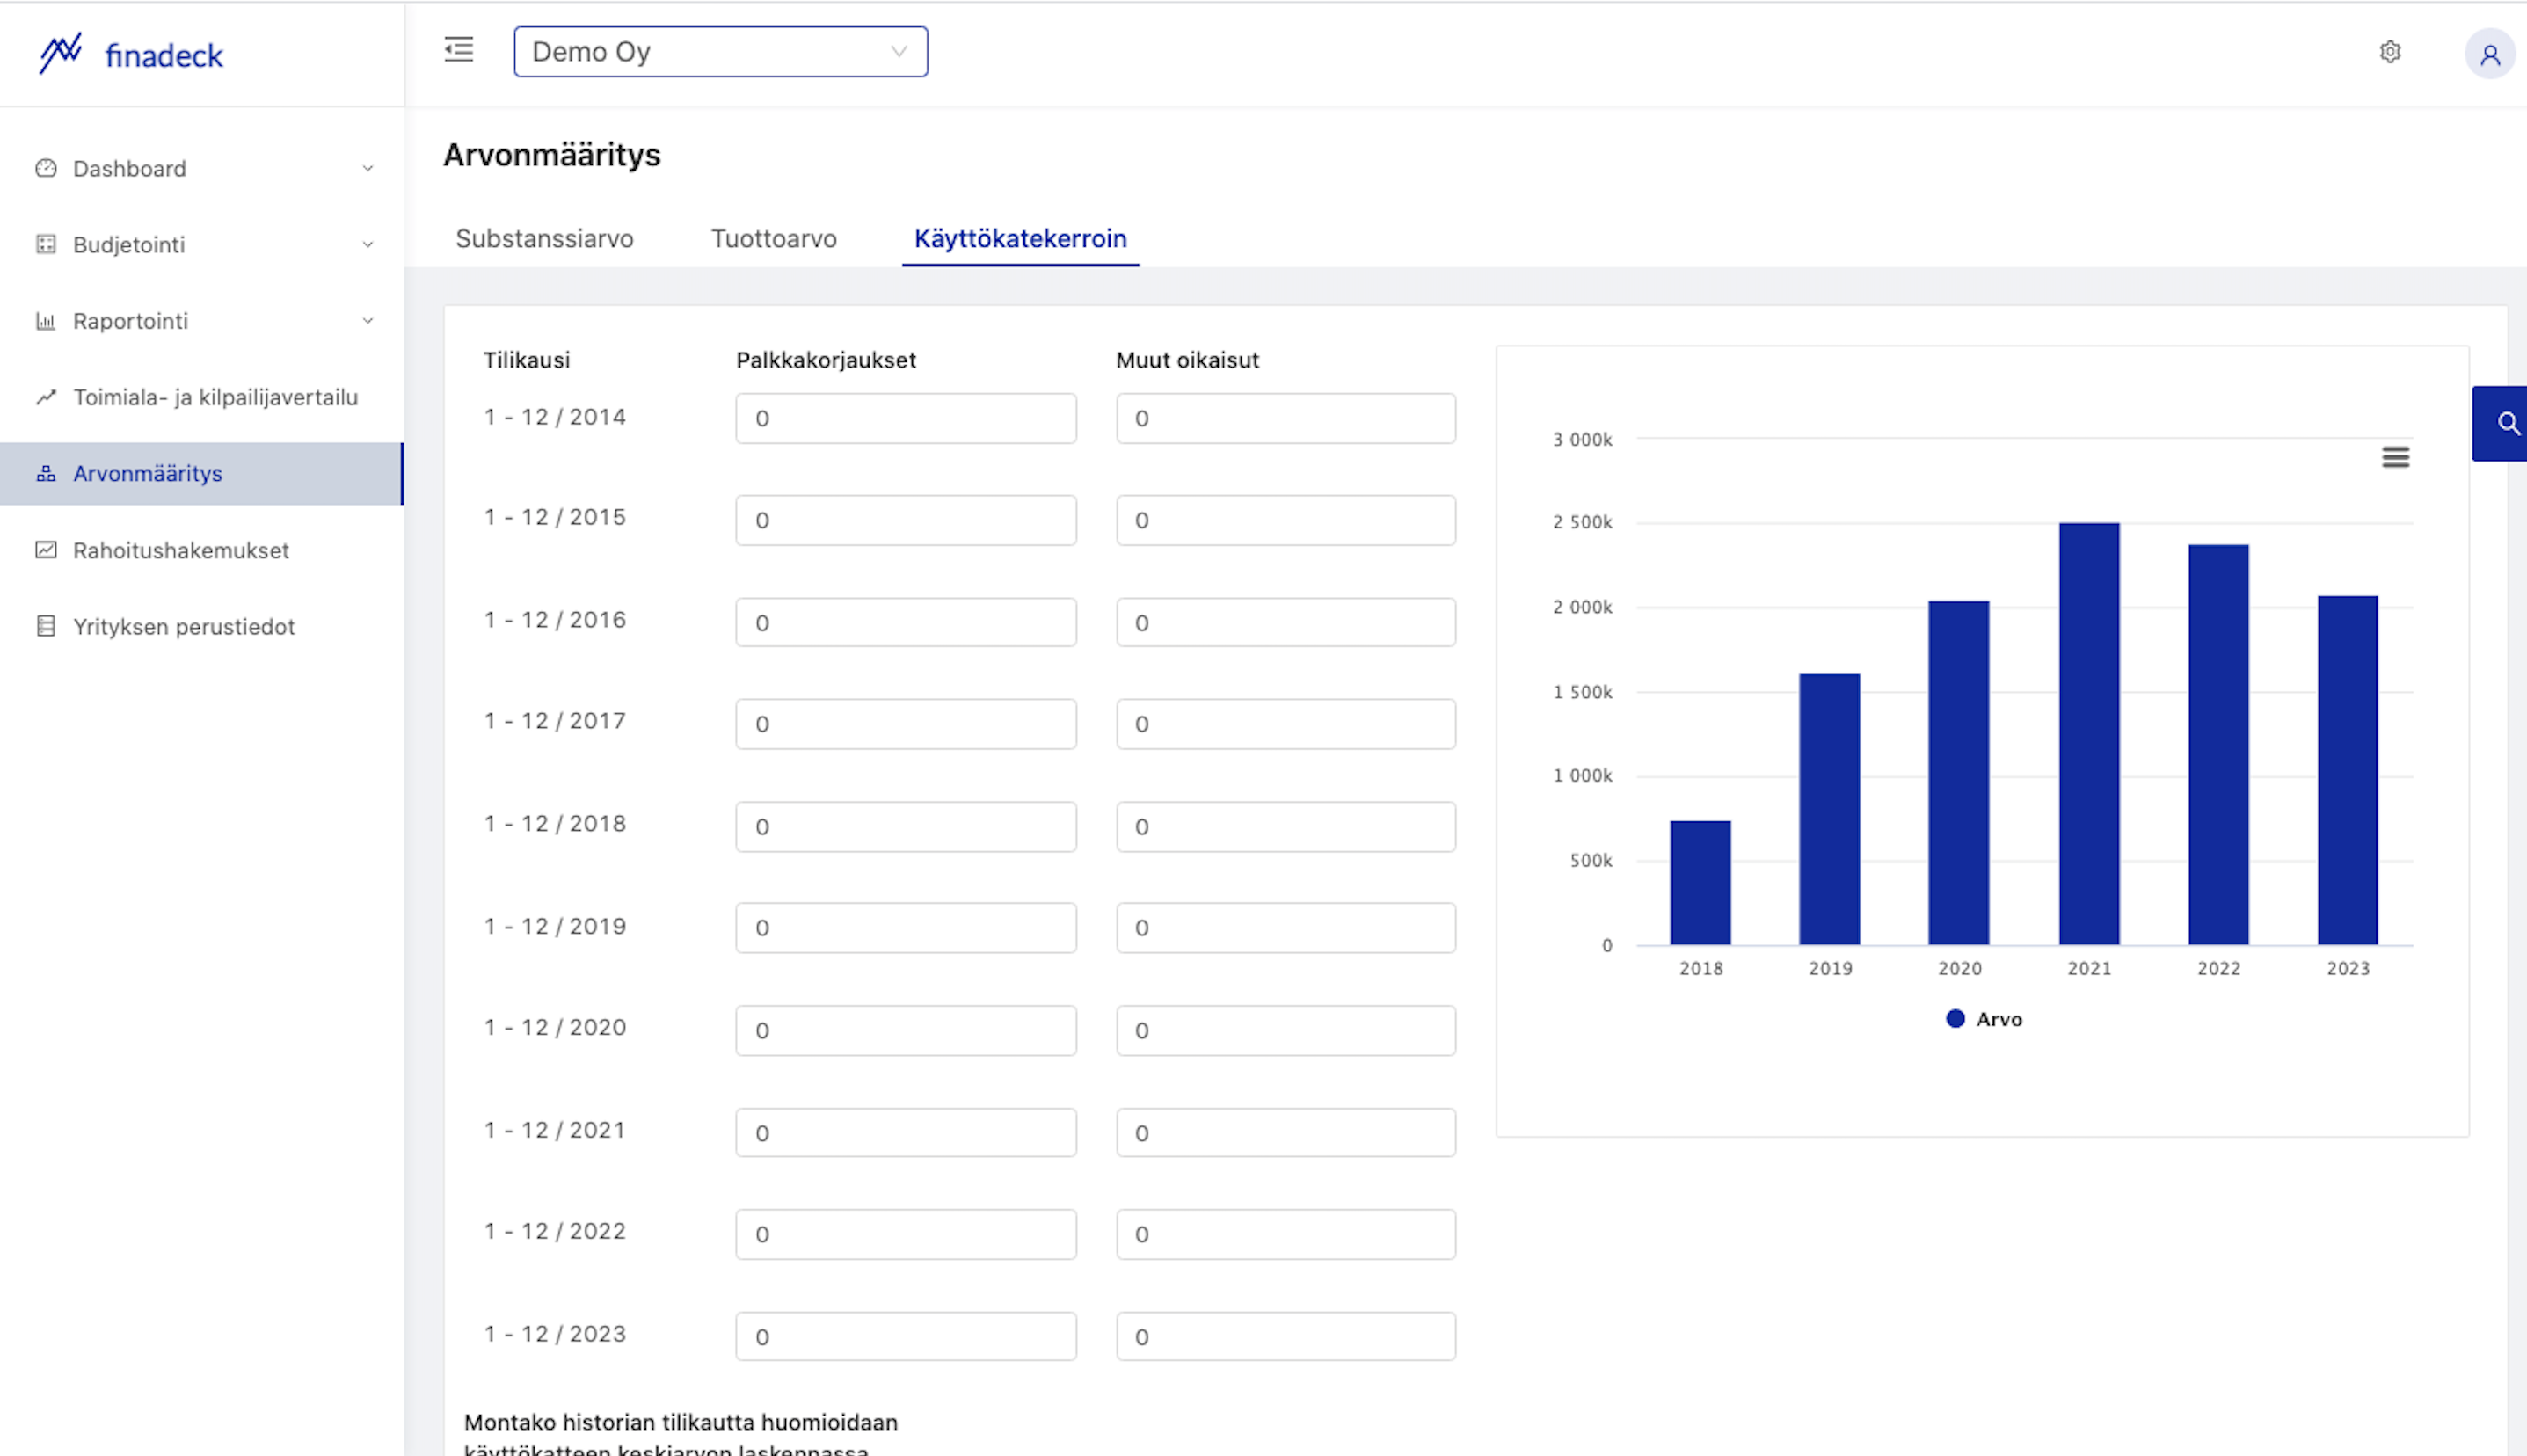
Valuation
In the valuation section, you can use different valuation models to see how the value of the company has evolved from the moment and how the result, investment and divestment plans and dividend distributions will affect the value of your company in the future.

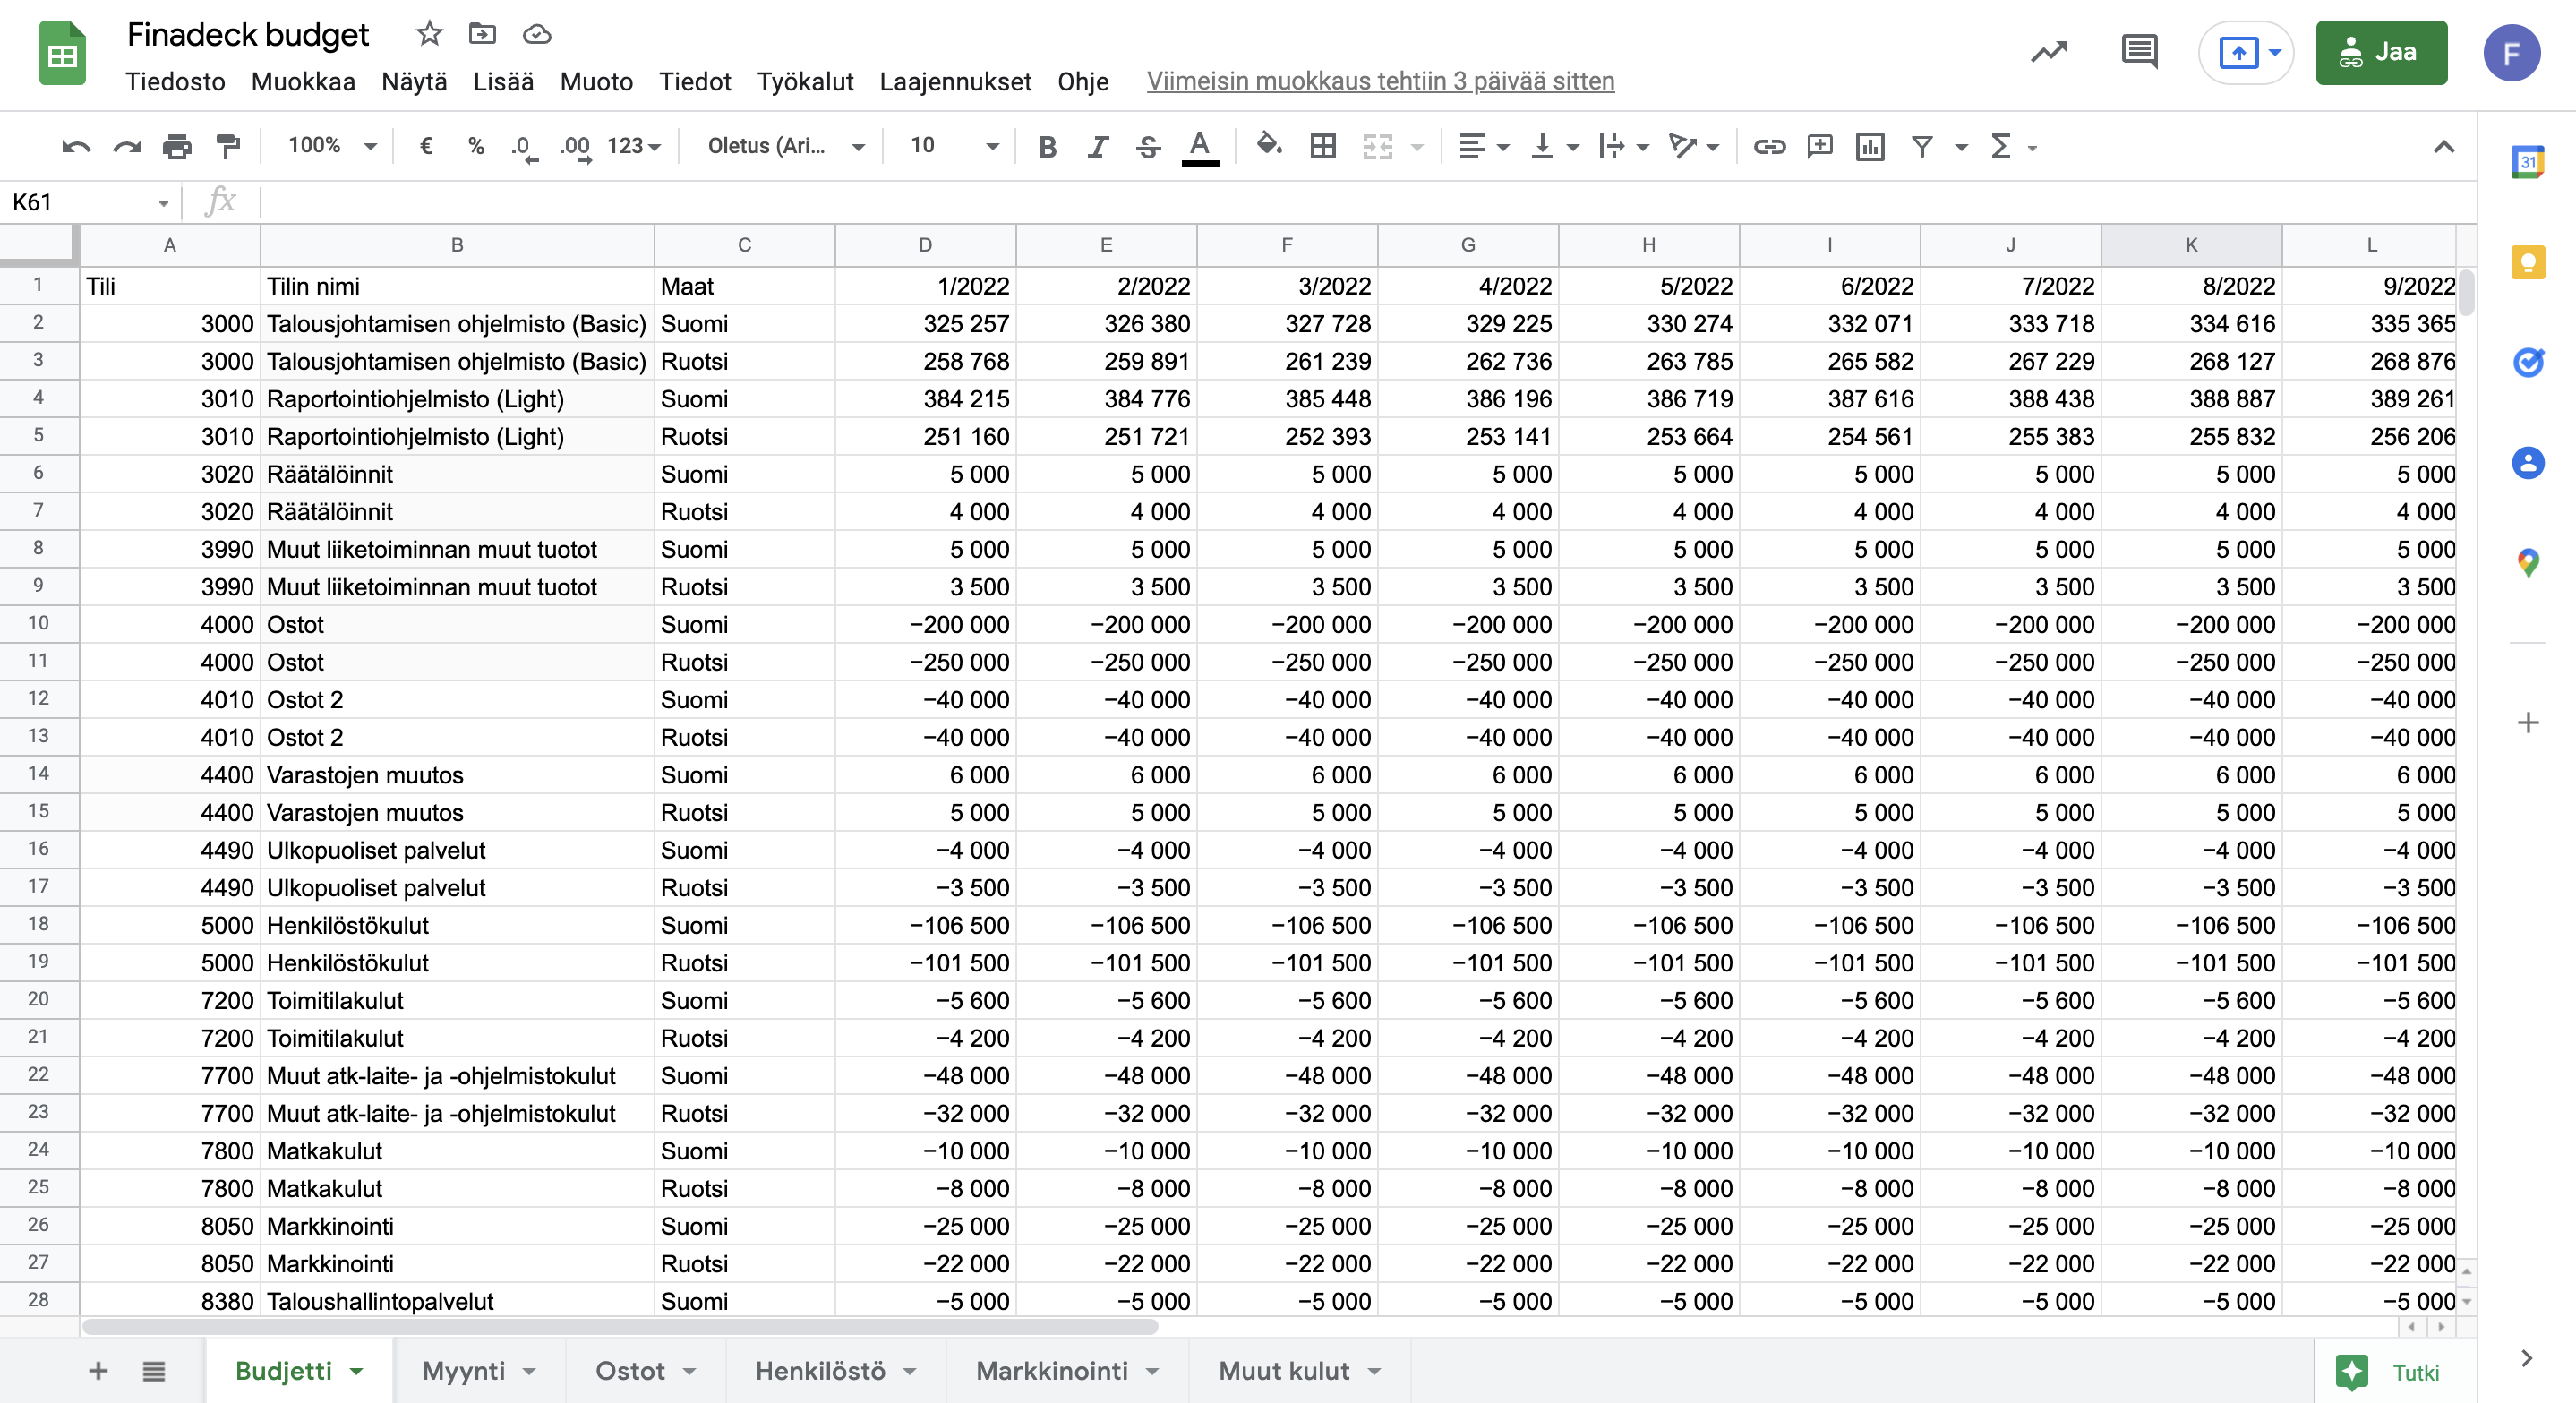
Google Sheets integration
With Google Sheets integration, you can:
- import all relevant data also outside from your accounting software or ERP into Finadeck
- Build the graphs and tables you want from the imported data itself.
- use the imported data to build your own key figures, such as:
- Customer acquisition costs /new customers CAC (Customer acquisition cost)
- Average income per account (ARPA)
- Customer Lifetime Value (LTV)
- Turnover / hours worked
- EBITDA per machine hours driven