Key figures and cash flow
Combine economic and operational business data
BI reporting in Finadeck reporting software
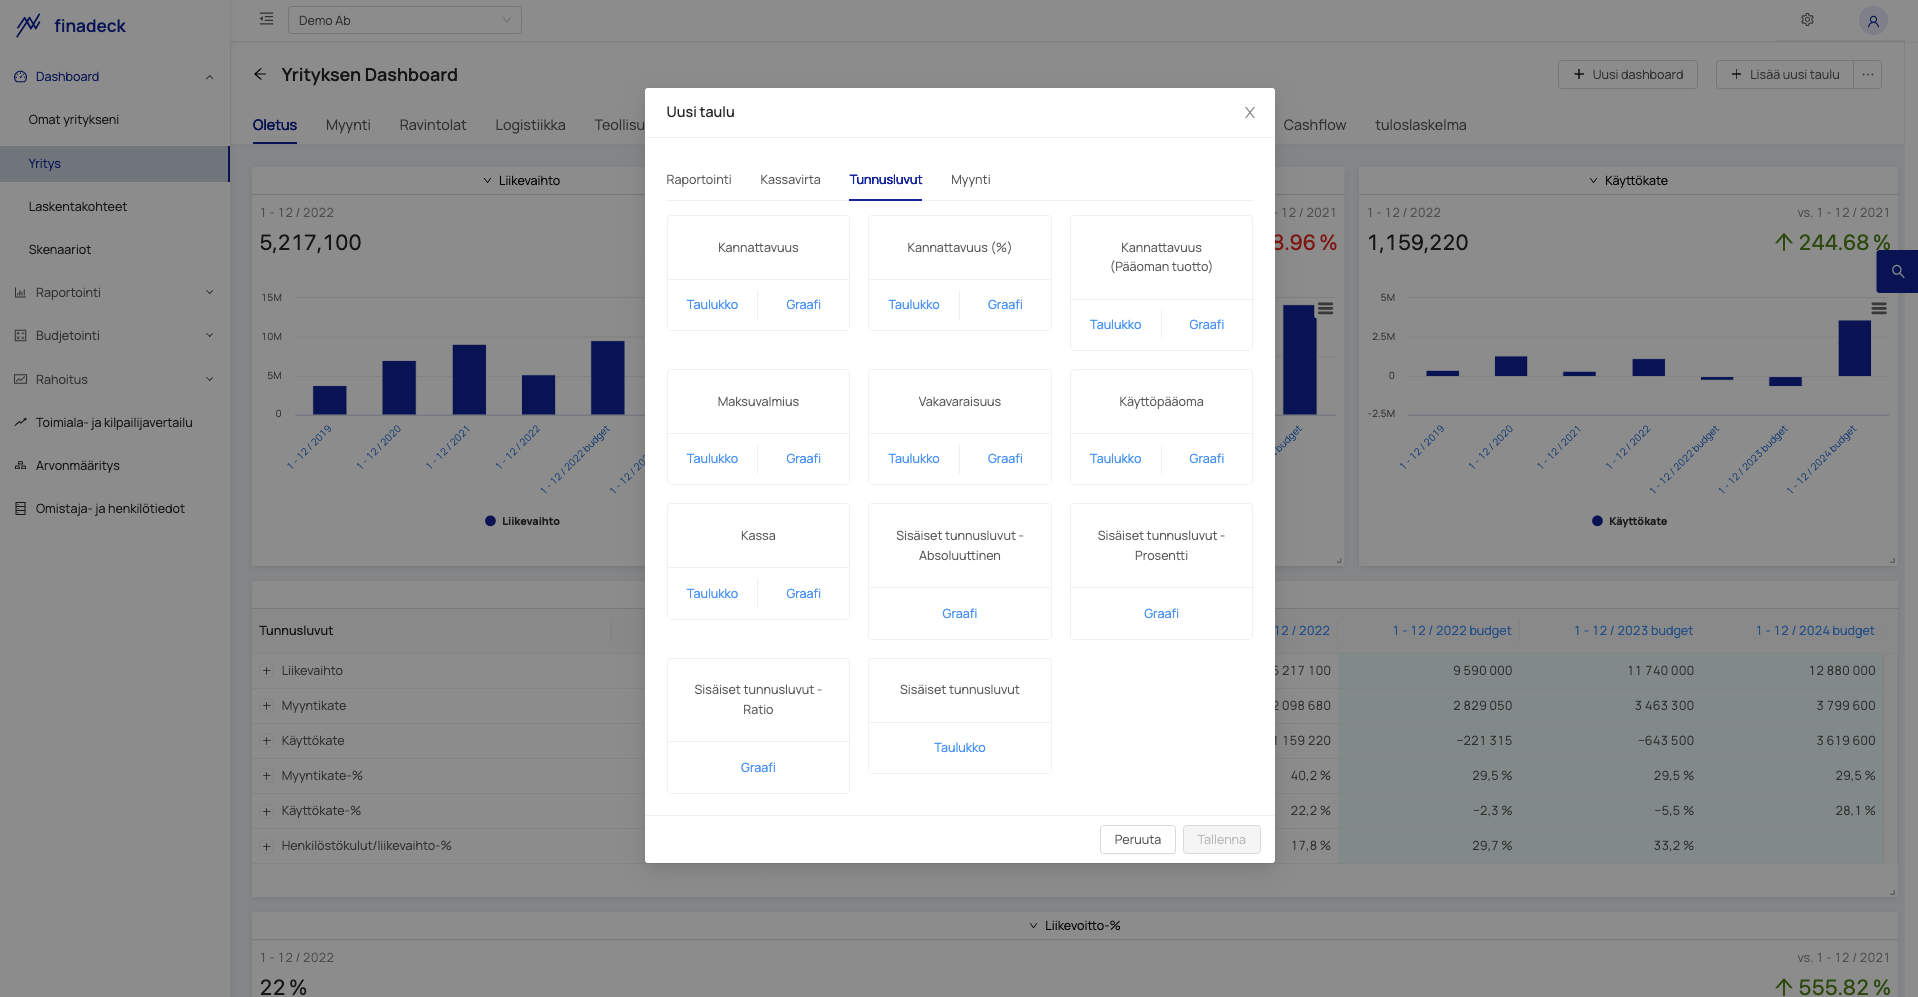
My key figures and BI reporting
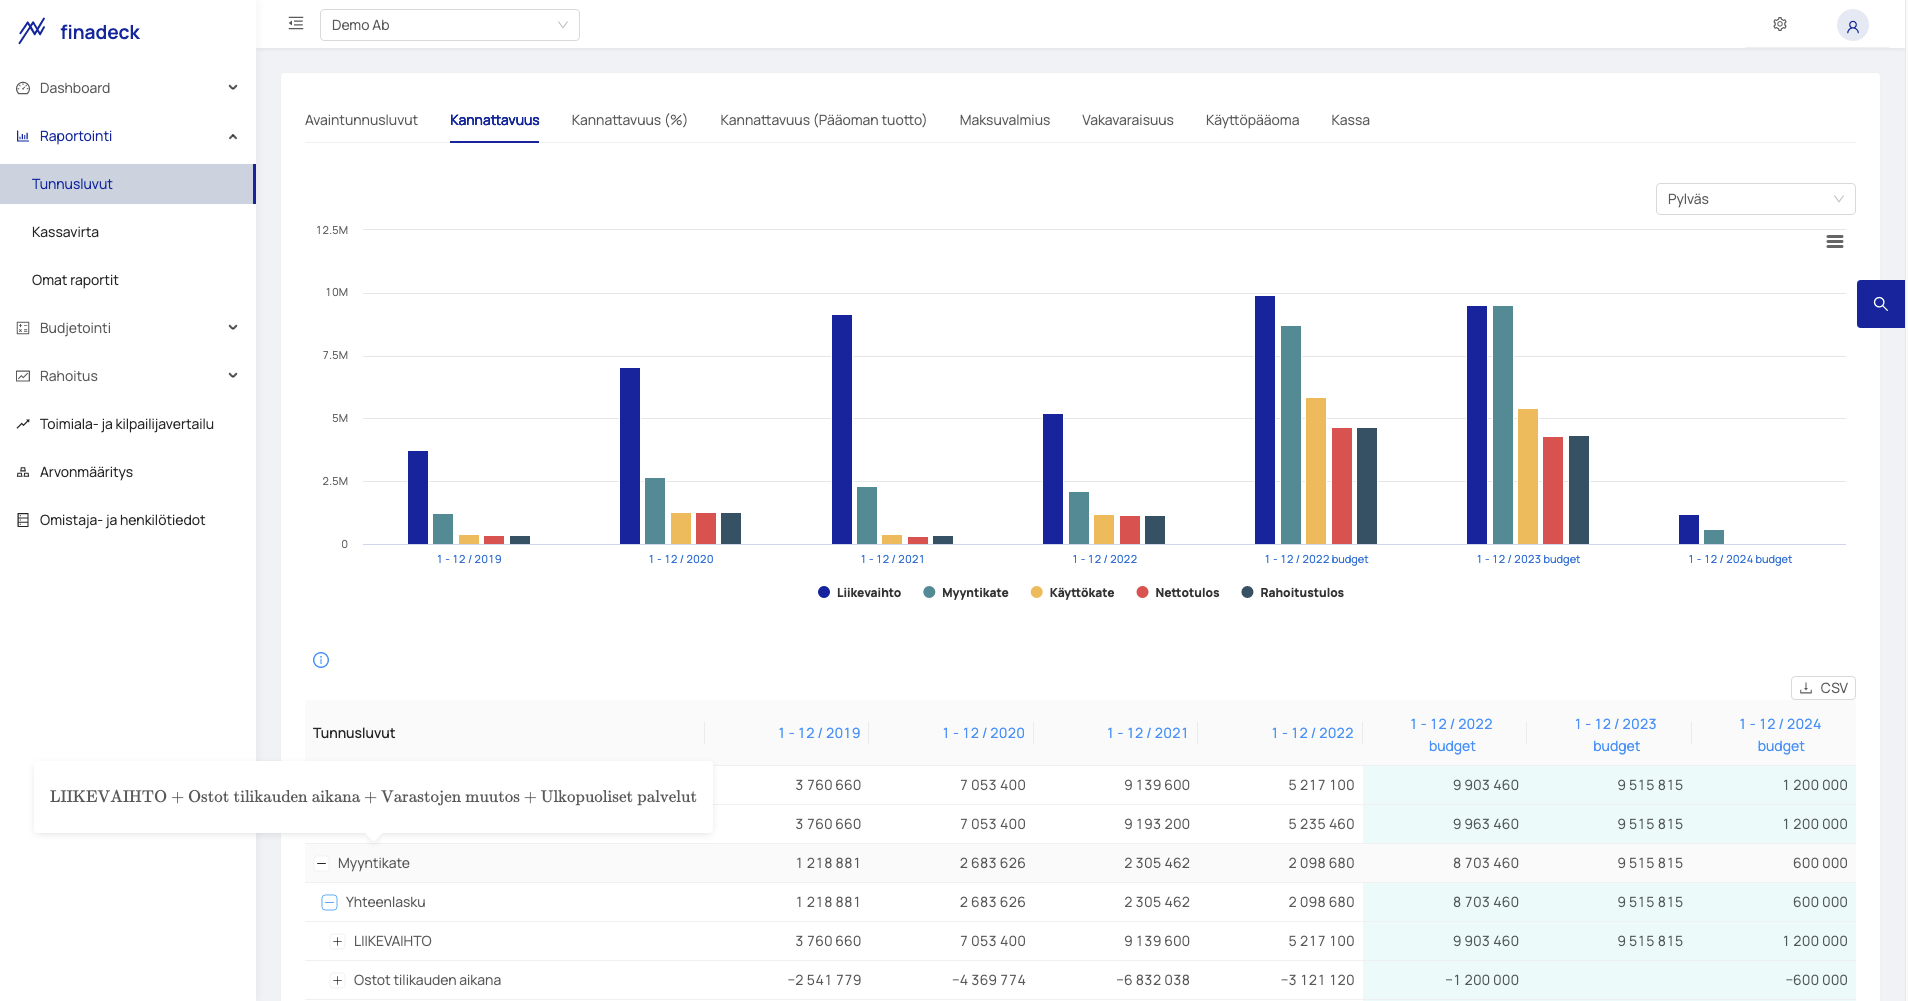
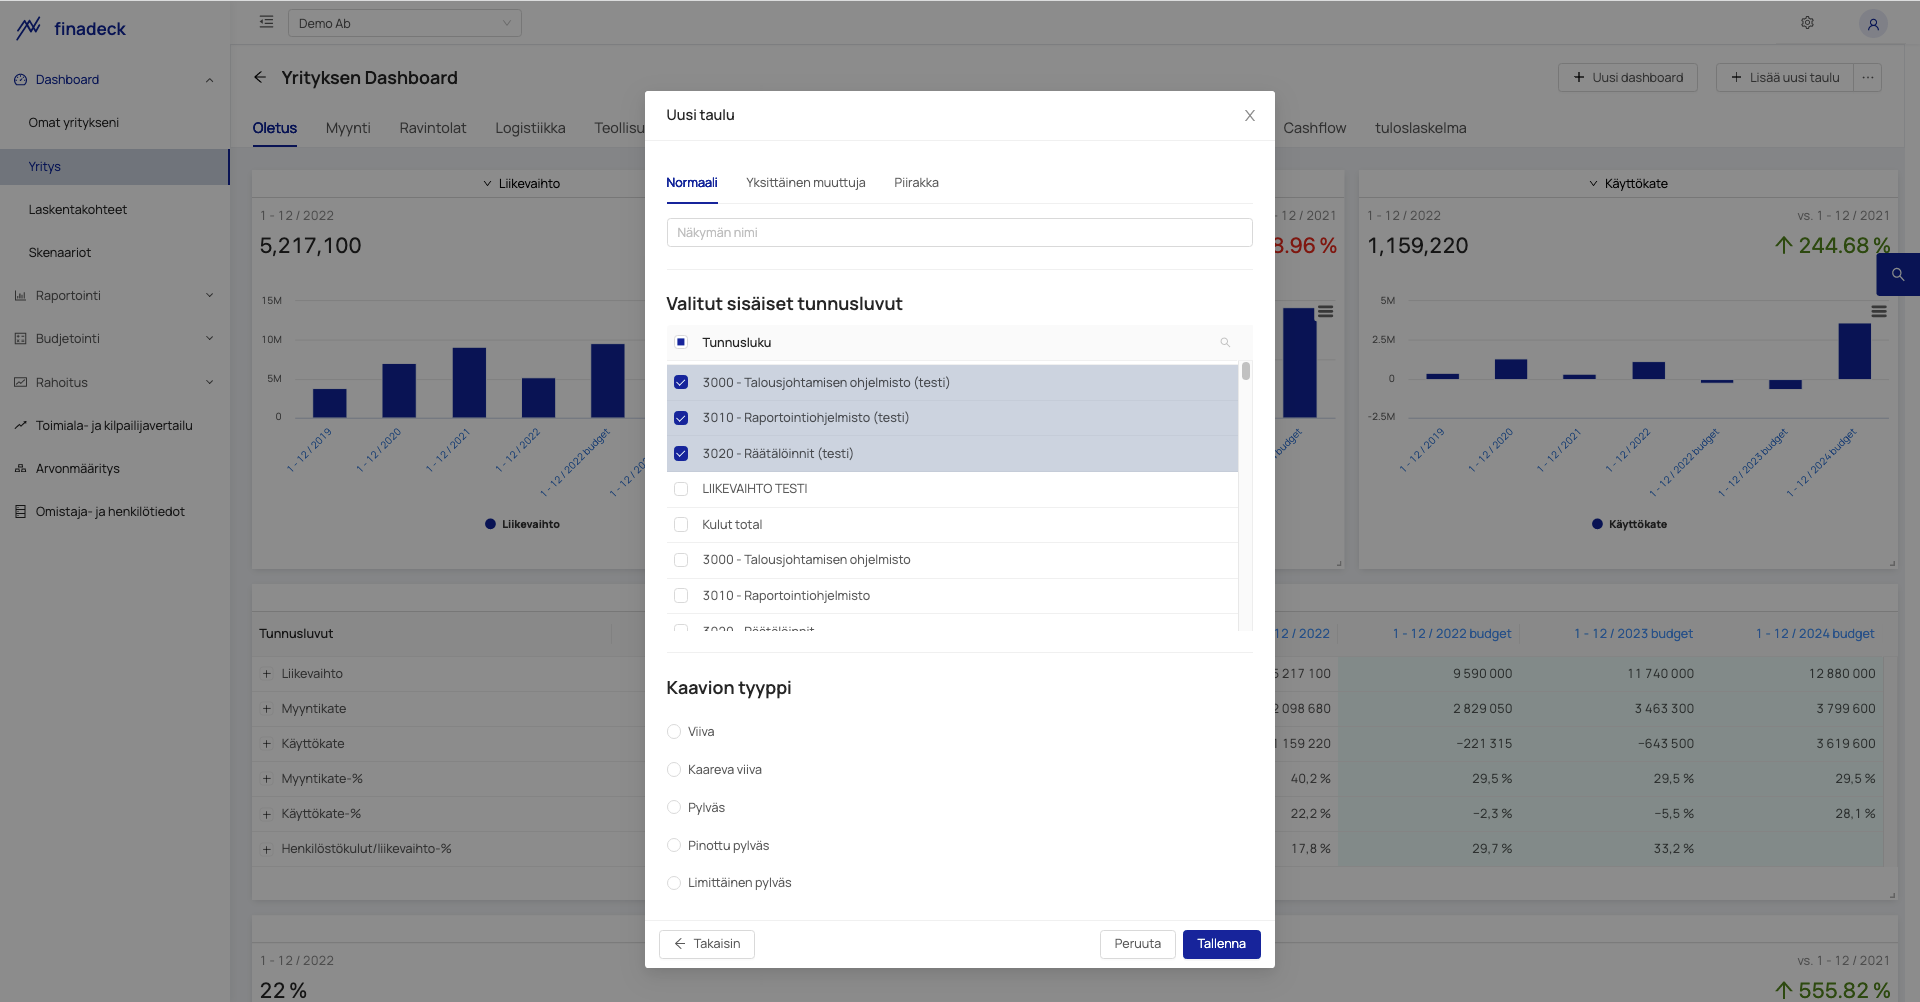
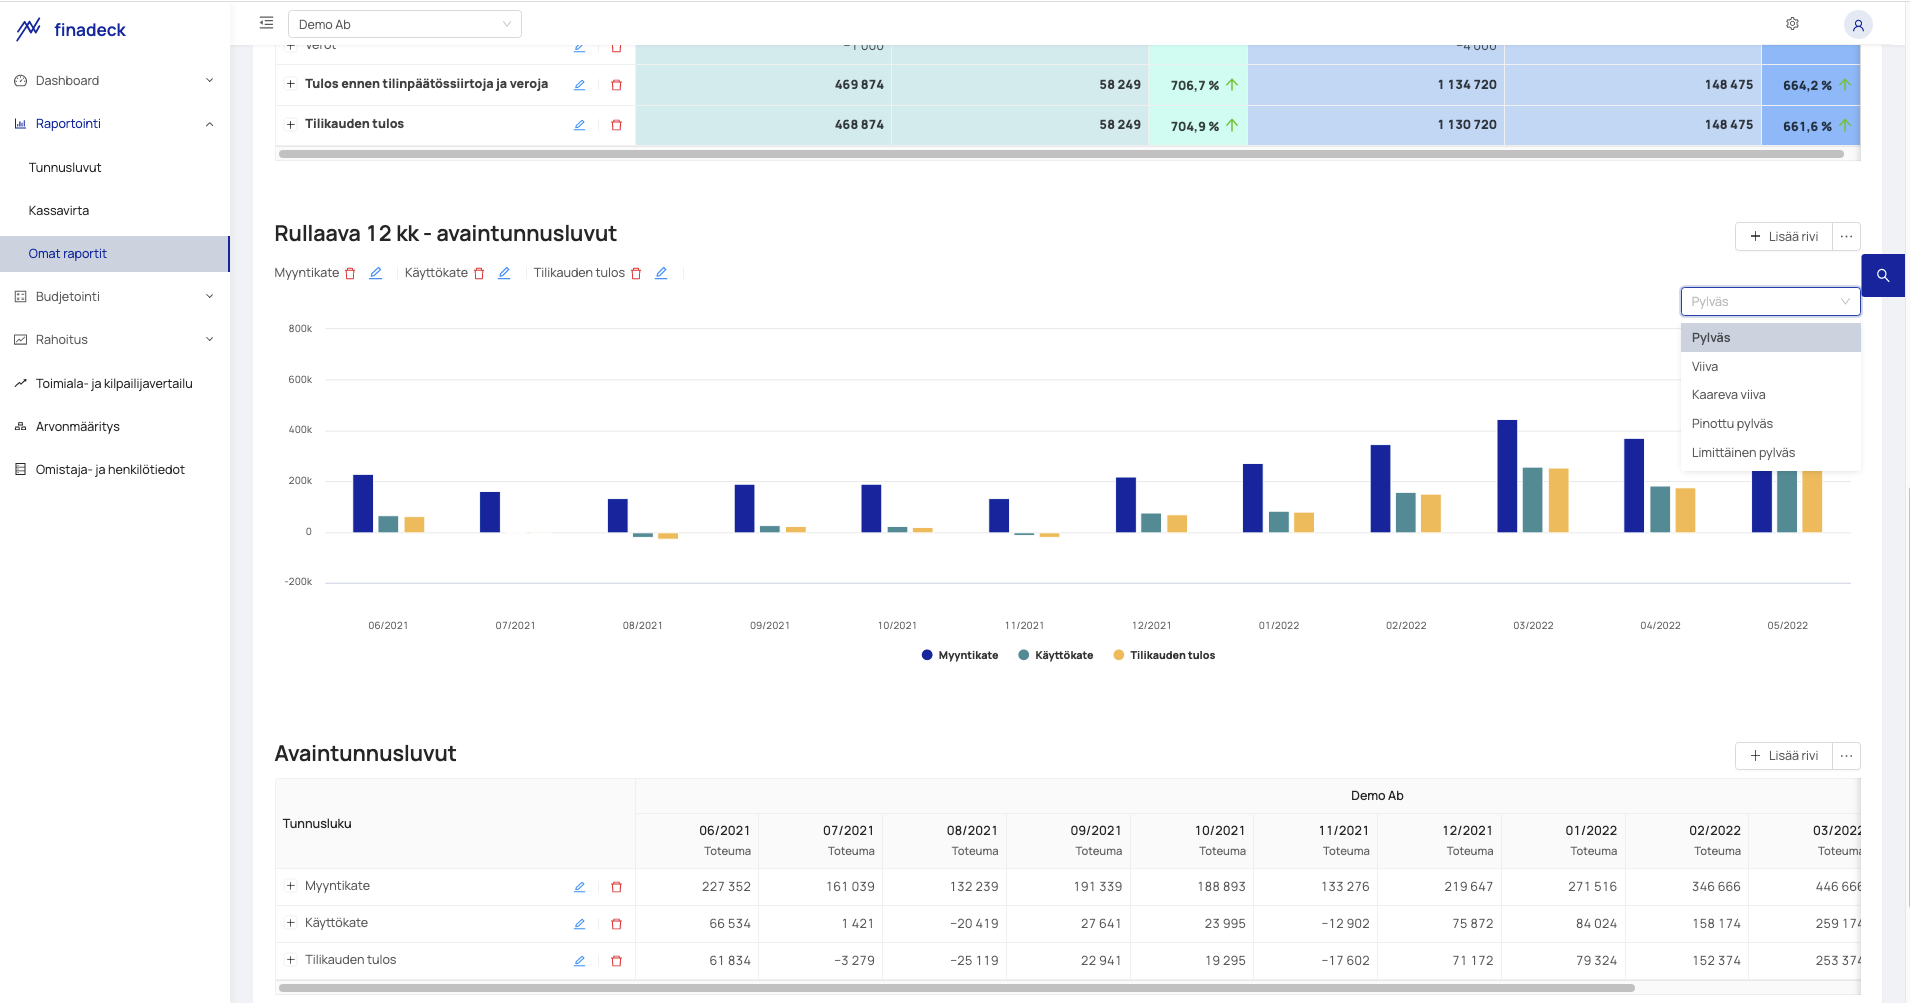
With finadeck's built-in formula tool, you can agilely build all the key figures you need for reporting from the data of financial administration and any other software integrated into Finadeck.
The formula tool can also be used to build composite indicators, such as fuel costs per km, in which accounting data is combined with data from daily business operations.
The instructions for the schematic tool contain comprehensive industry-specific examples for building internal key figures. Building internal KPIs for a company is part of the implementation.
Cash flow
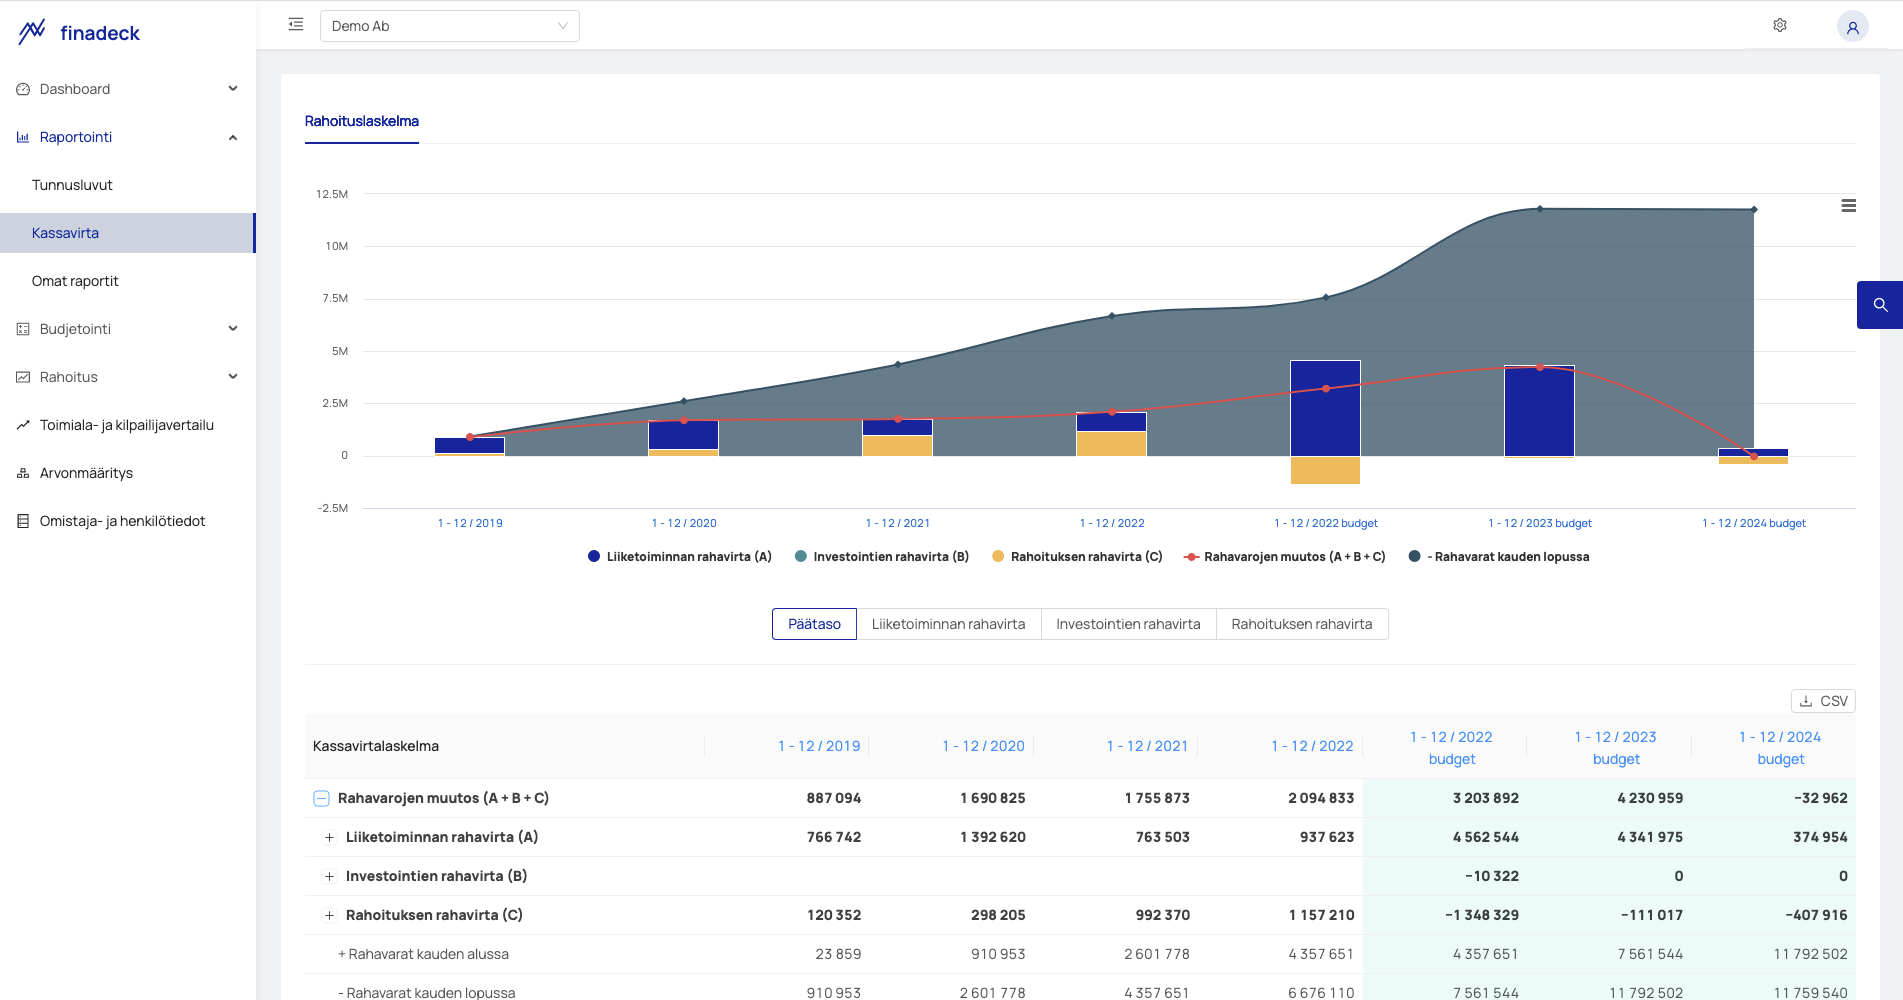
Finadeck automatically generates a financial statement from accounting data, budgets and forecasts that drills down to the voucher level.
In addition, it is possible to build your own financial calculations in Finadeck by building the key figures needed in the calculations using the formula tool built into Finadeck.
Data visualization and report submission automation
Build, visualize, and automate the reports you want for the people you want
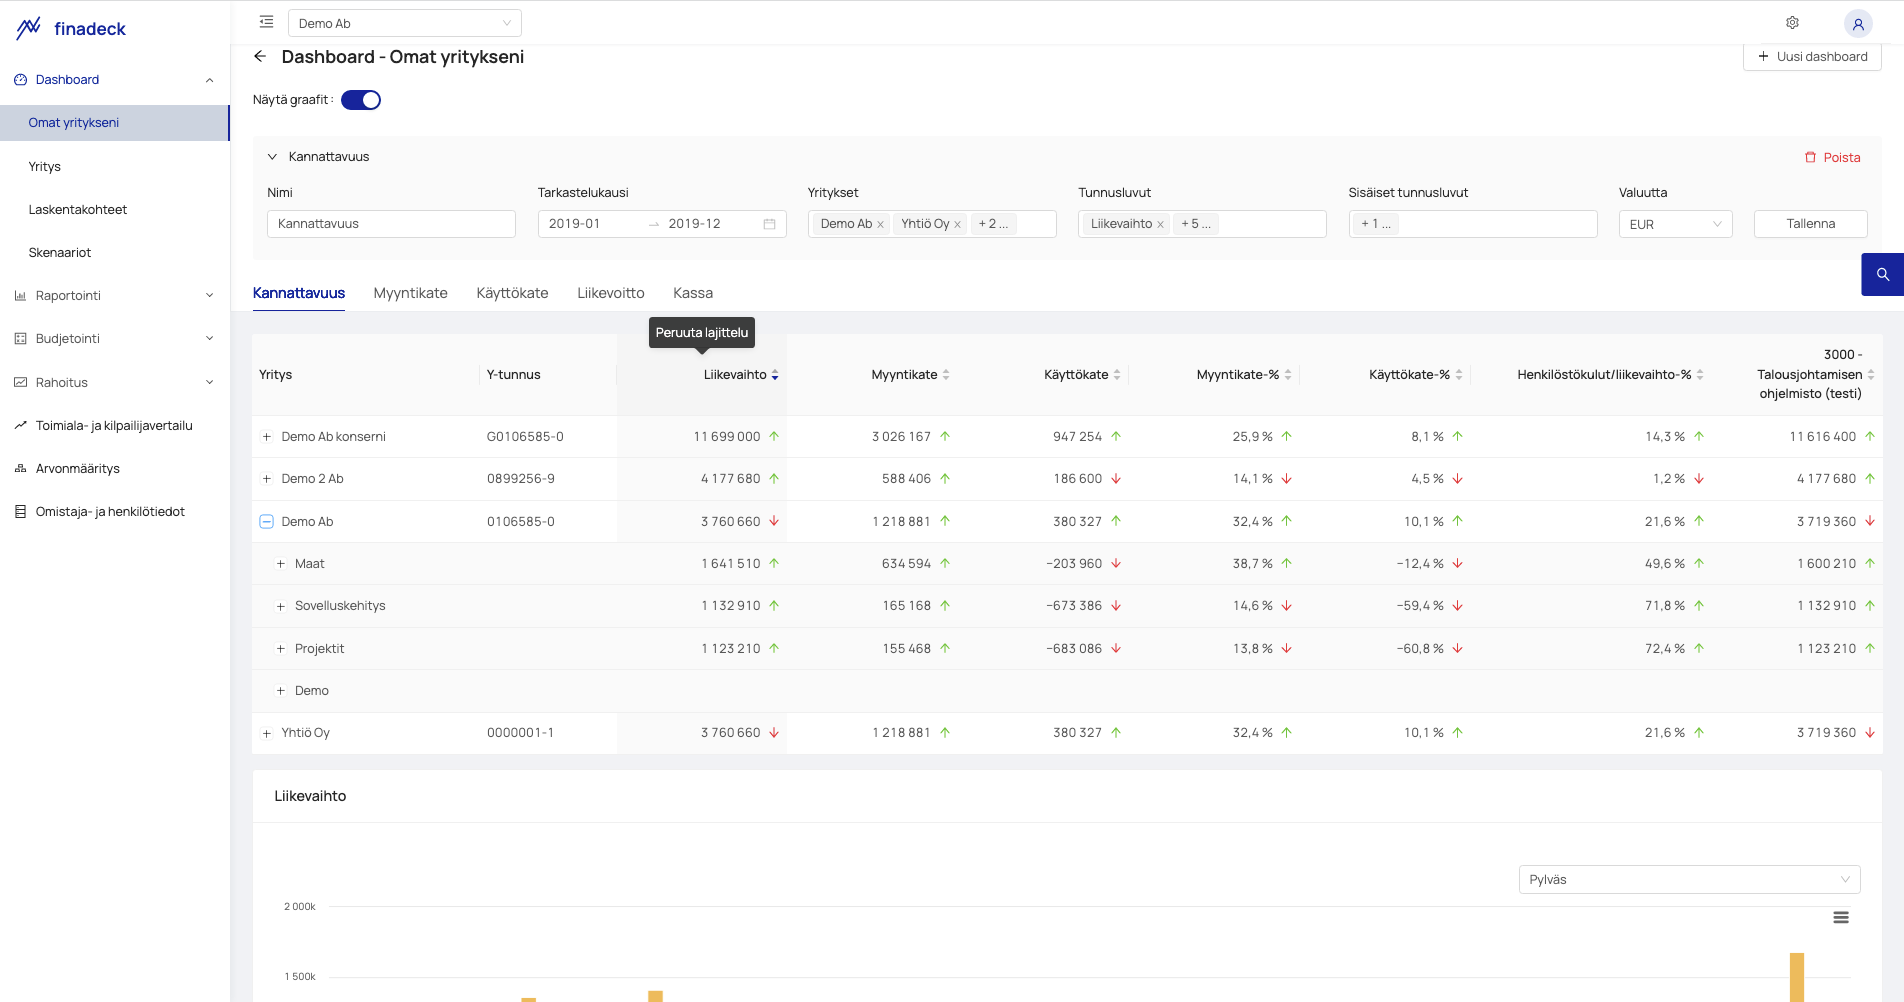
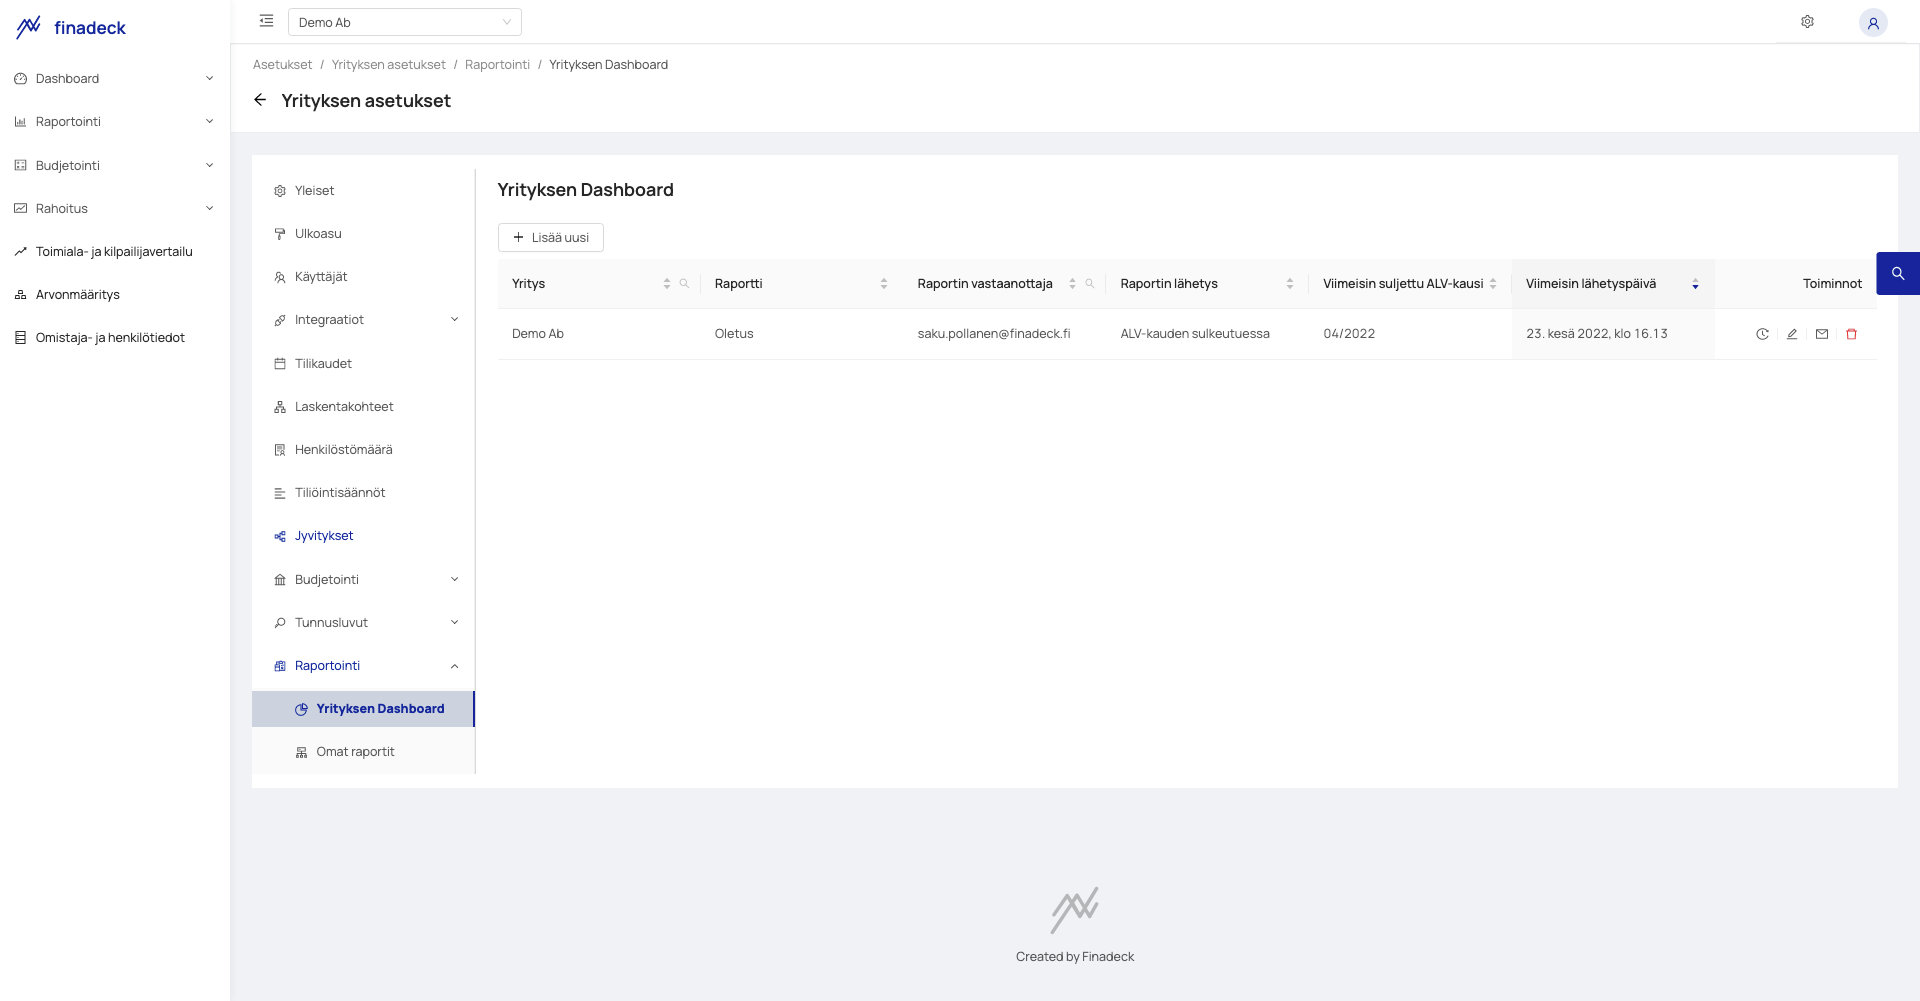
My companies dashboard
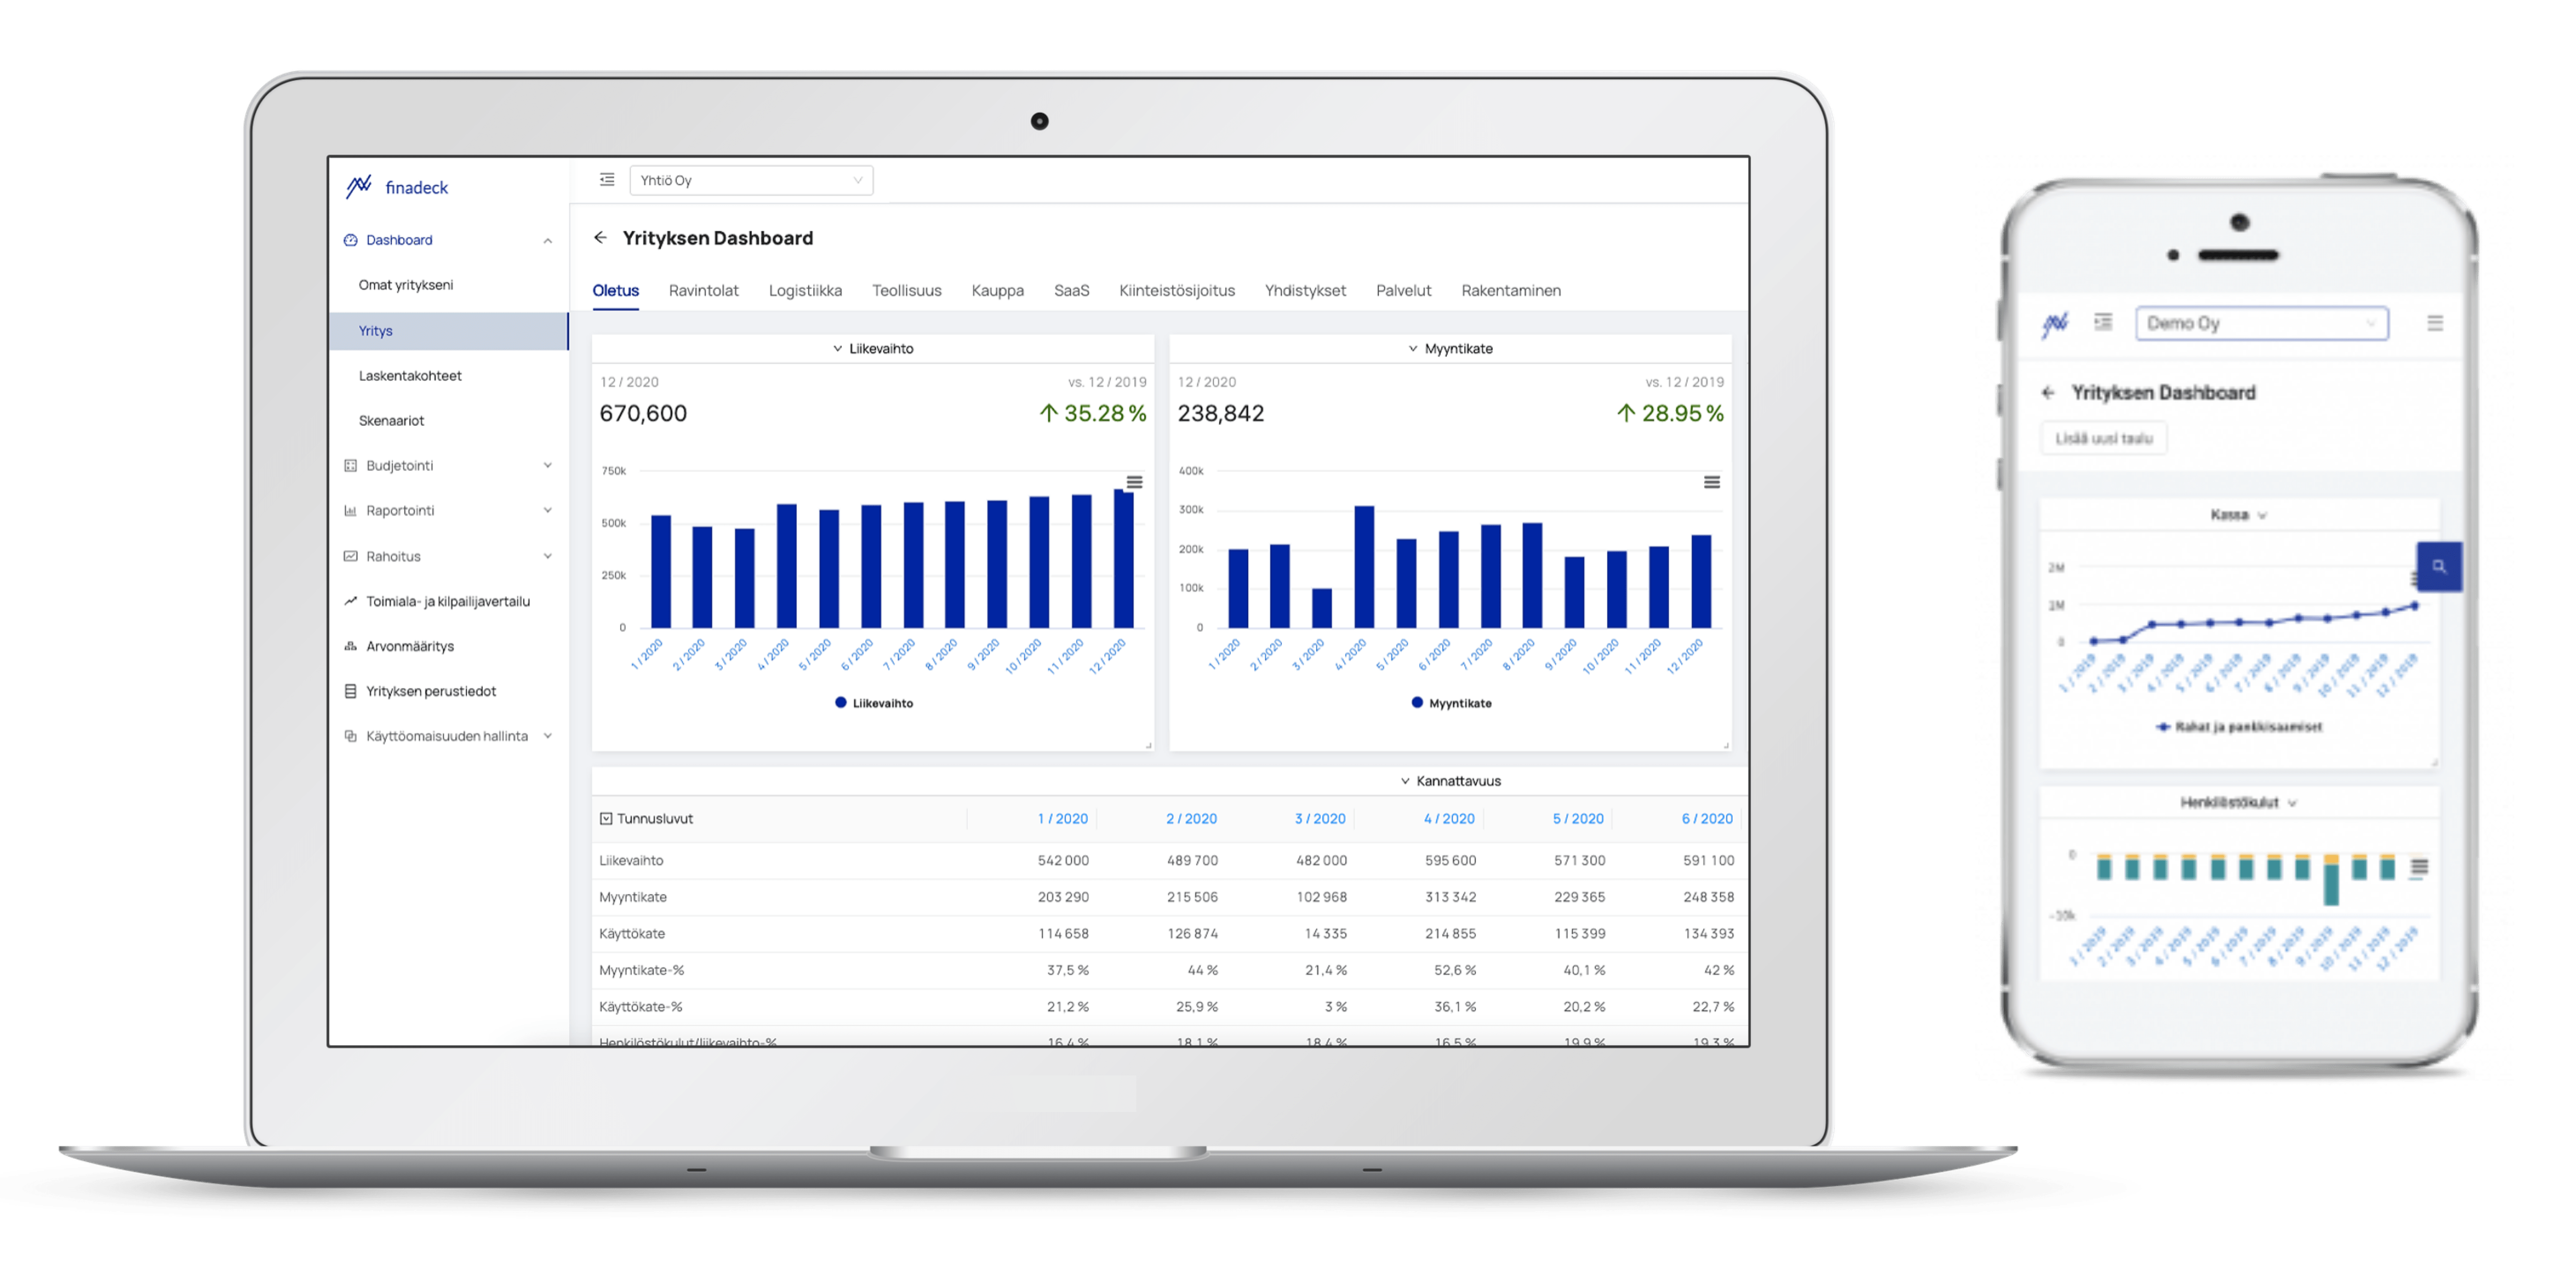
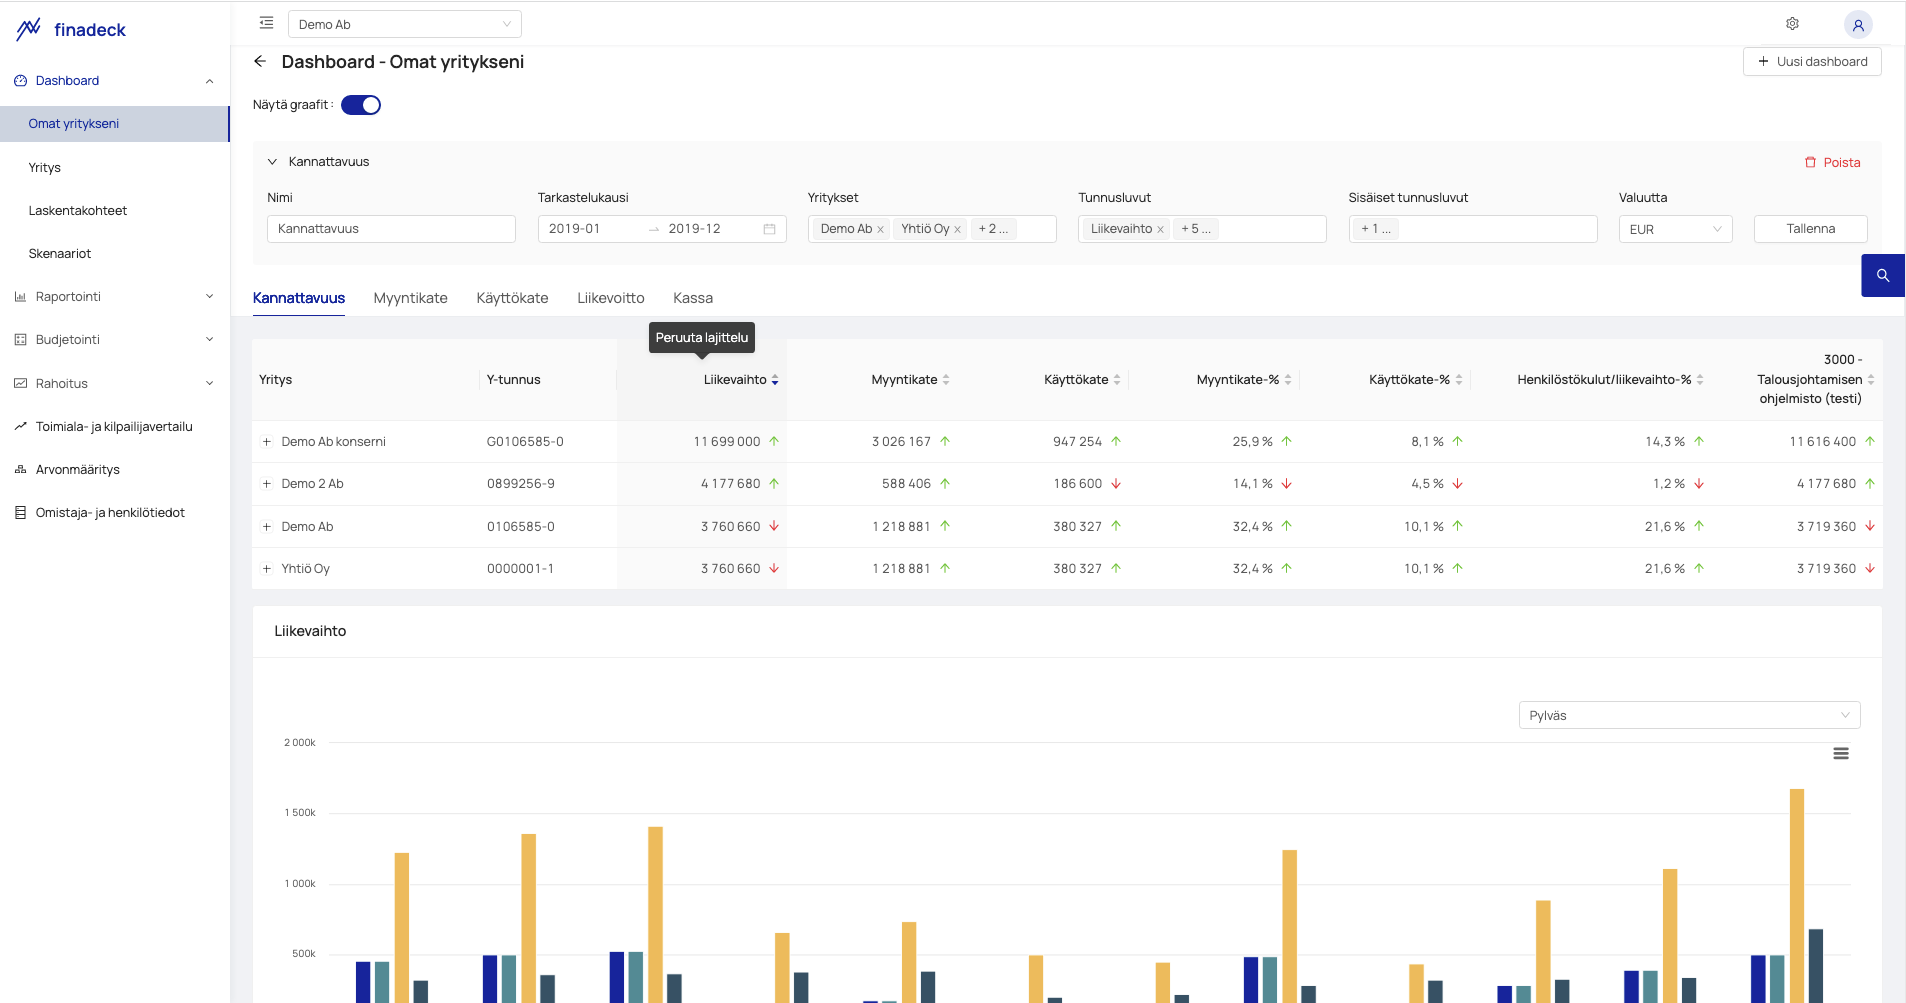
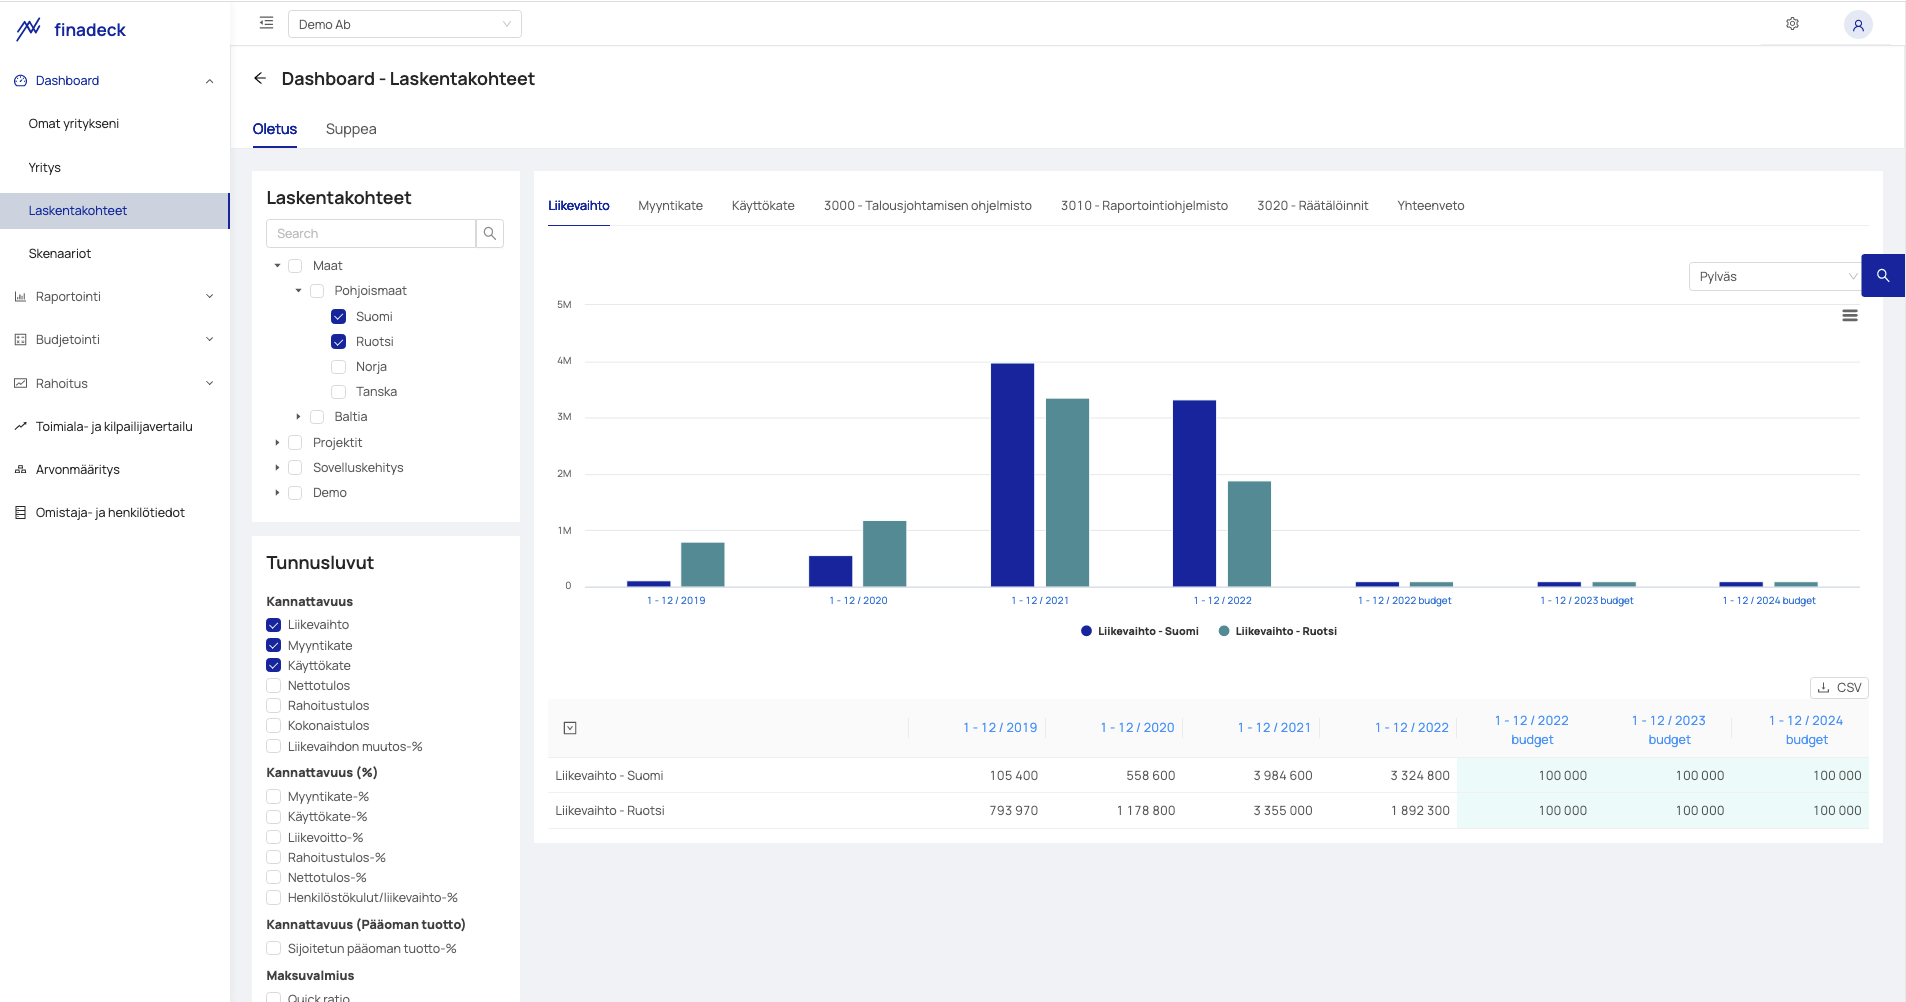
The My Companies dashboard is designed for centralized monitoring of the financial status of the group, the group of companies and the franchise chain, as well as the key figures of daily business operations.
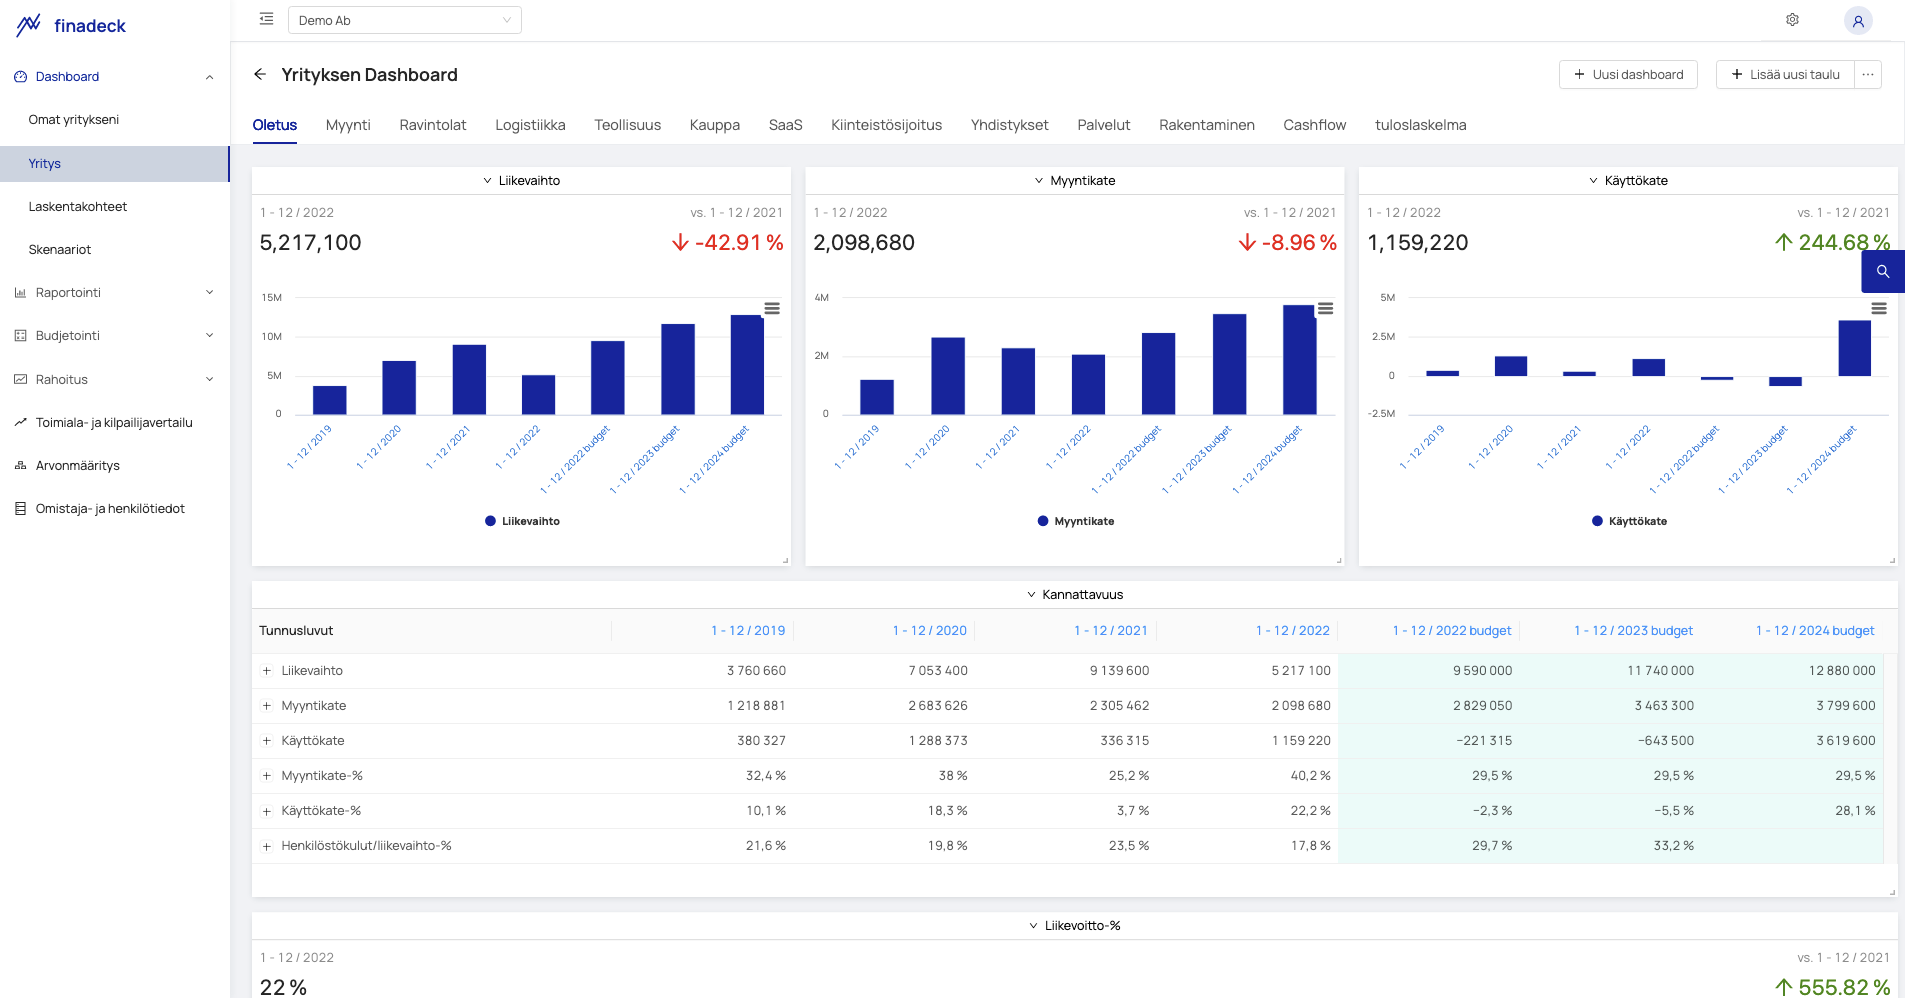
Company dashboard
The company dashboard is designed to dynamically view the financial status of an individual company or its individual calculation target, as well as the key figures of daily business operations.
Cost Center Dashboard
The calculation targets dashboard is designed for centralized monitoring of the financial status of the company's calculation targets and the key figures of daily business operations.
Report builder to build your own report frames
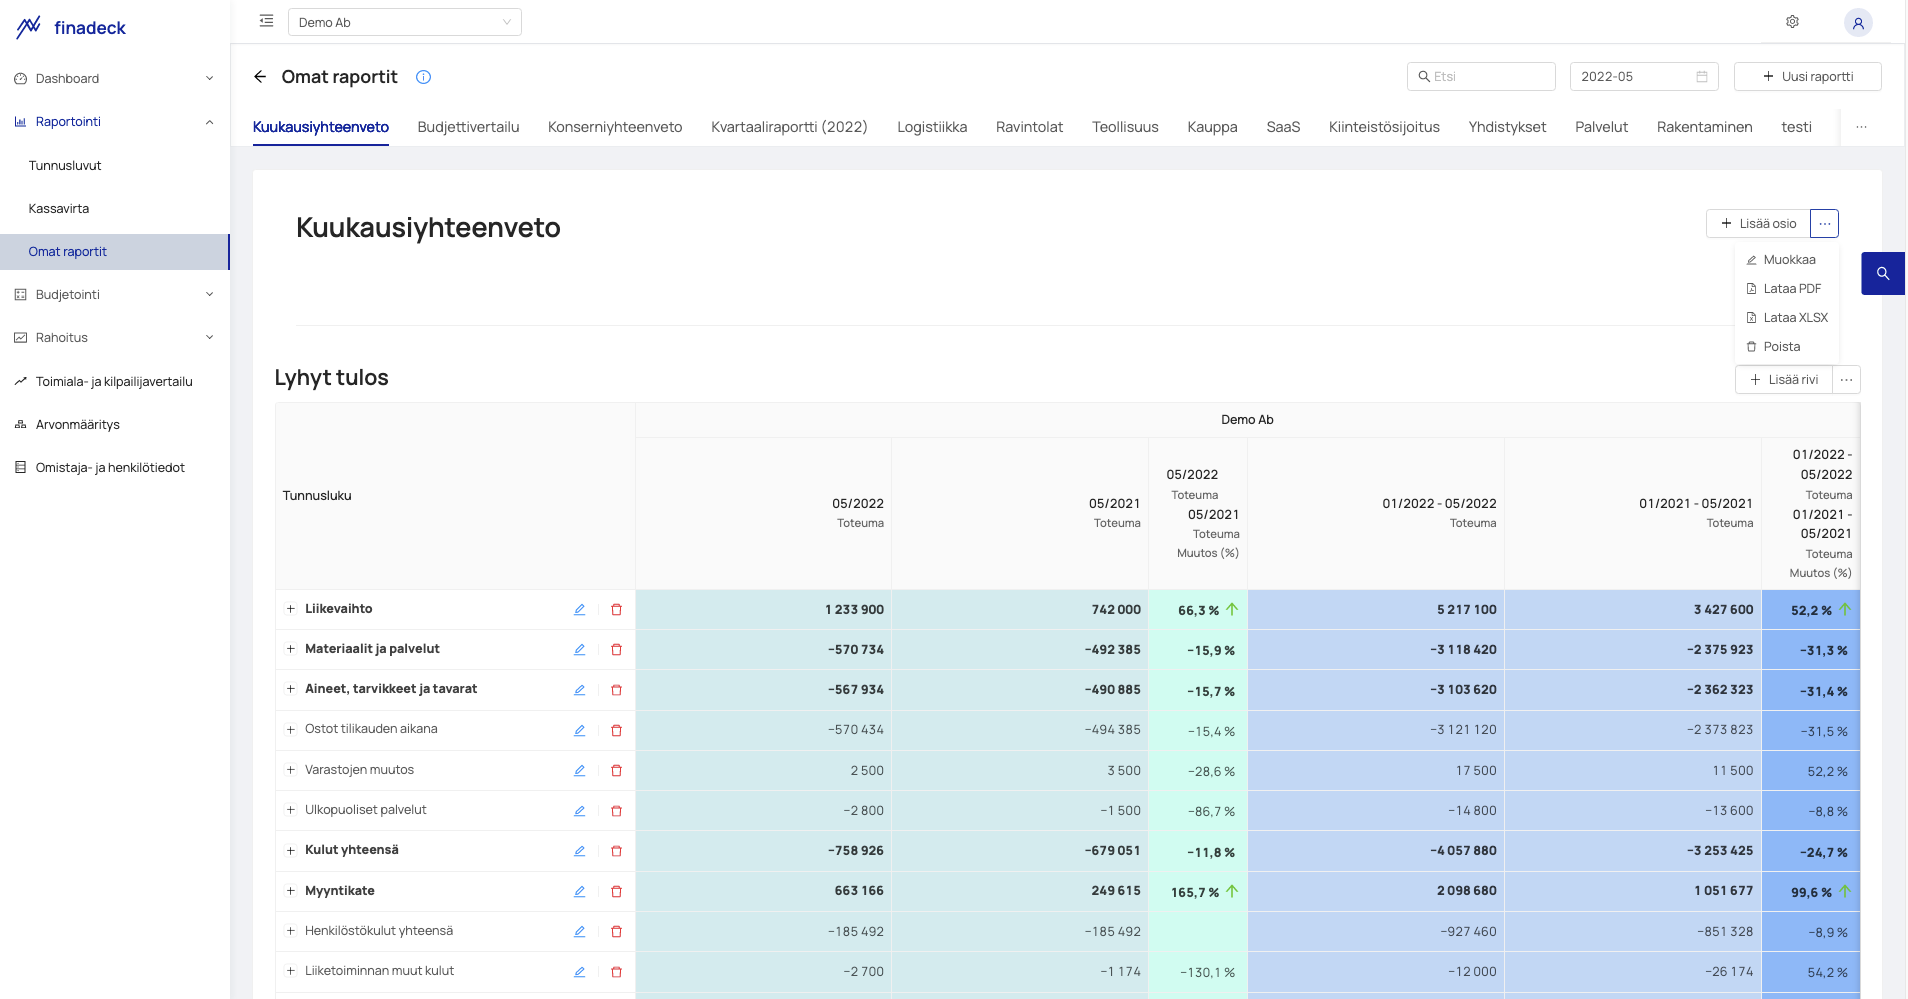
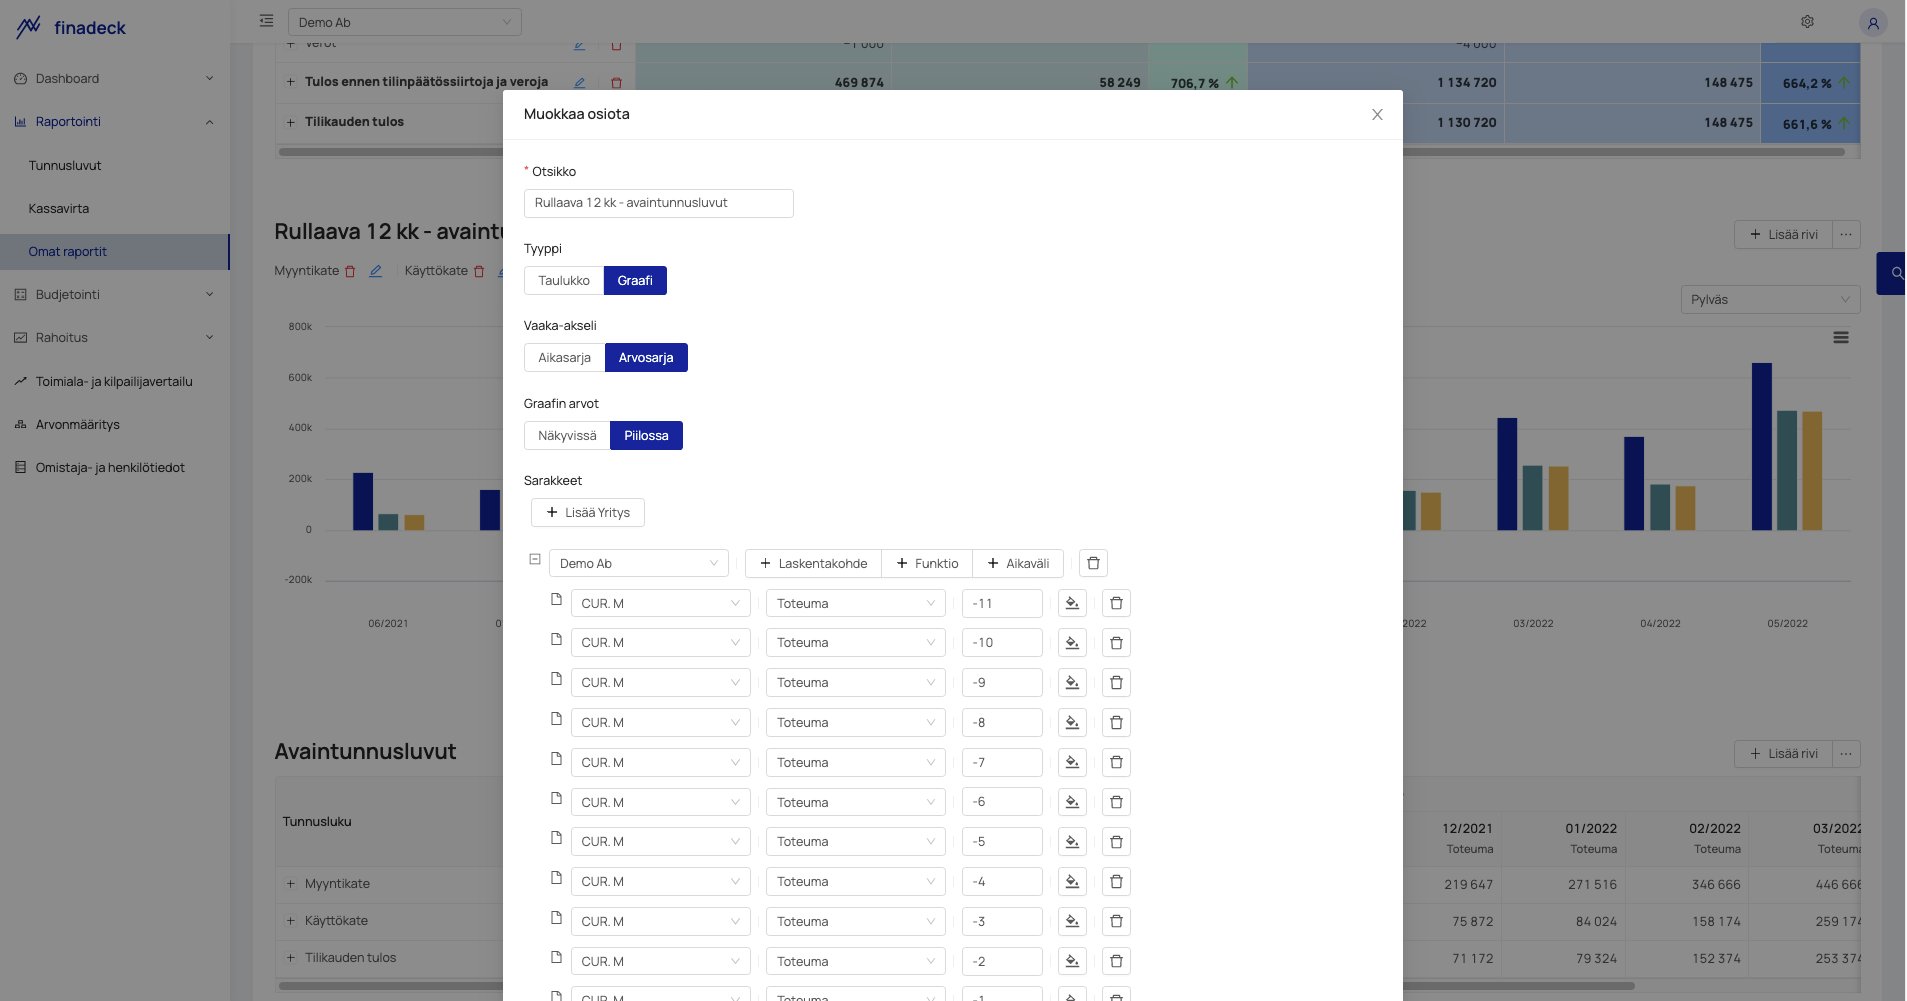
The report's building tool and its own reports section are designed for building and monitoring management and government report frames.
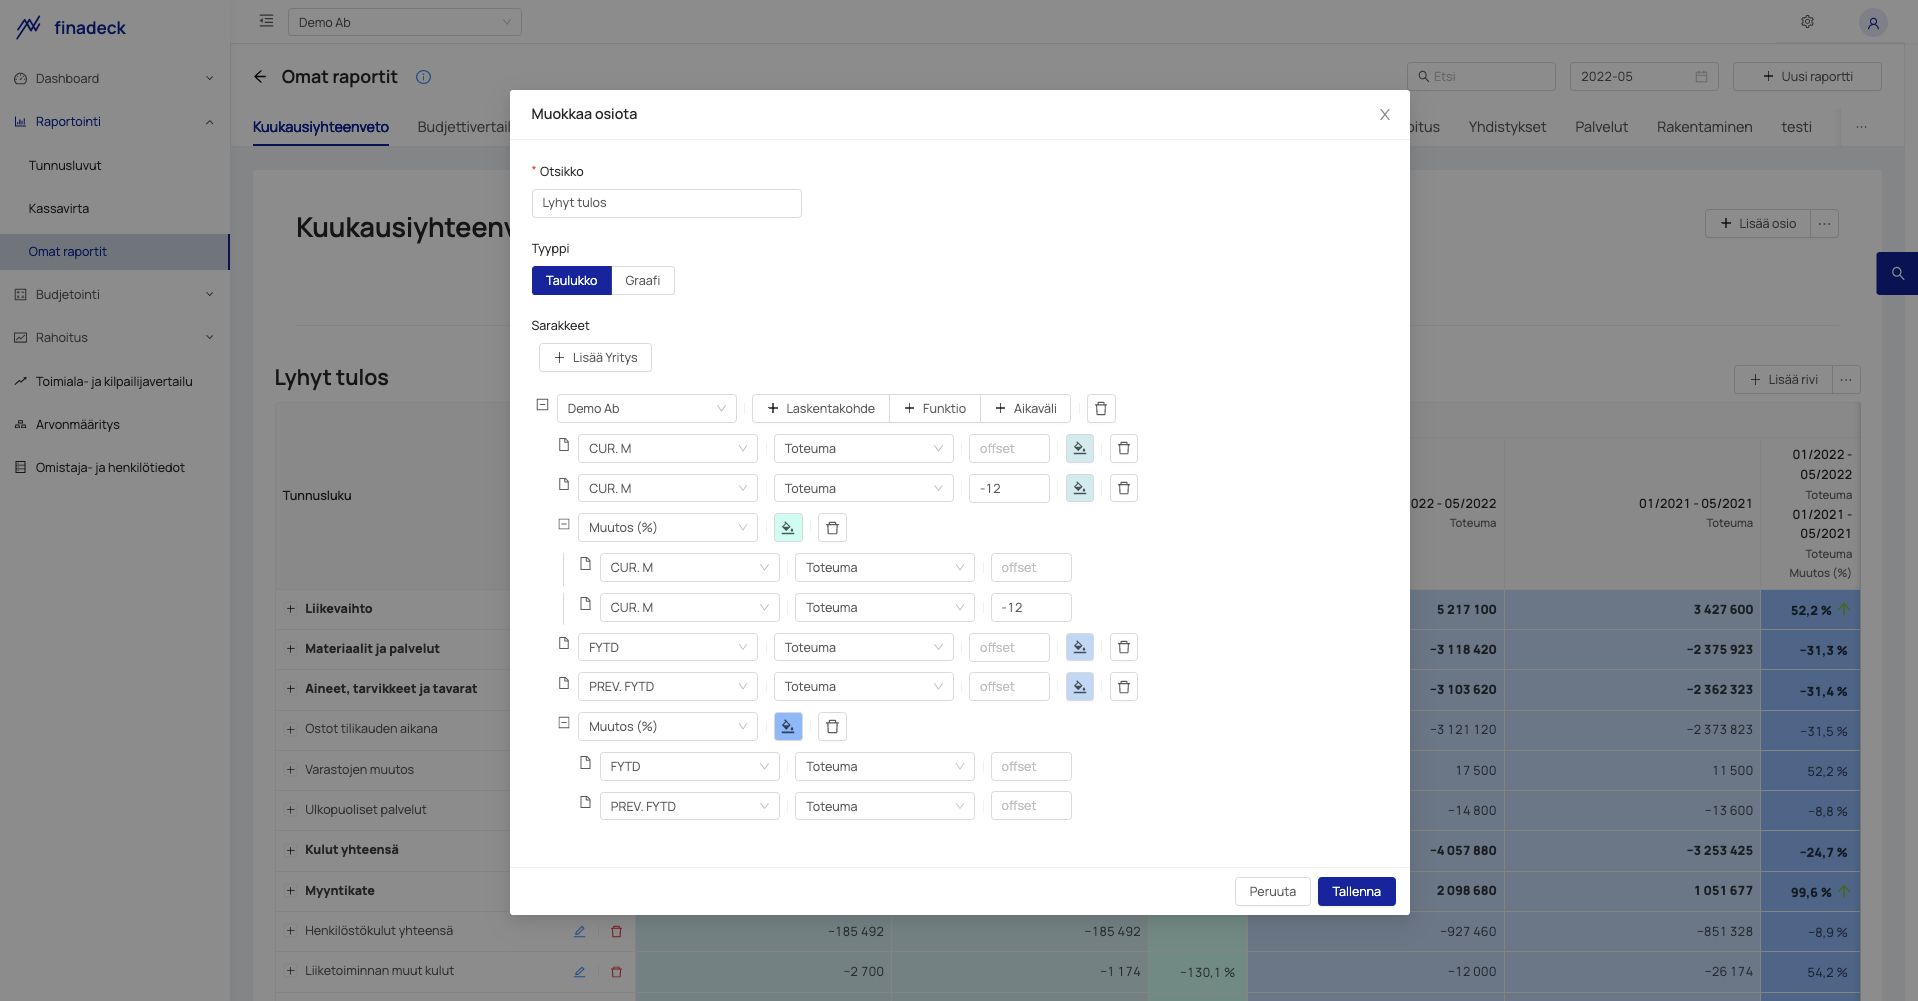
You can use the report builder to select the desired companies and/or calculation items, intervals, data types, and calculation functions for the columns you want, and the key figures you want for tables and graphs, and to complete the visual appearance of your reports.
The report's building tool is ideal for building and monitoring the reports mentioned below, among other things.
- Group sheet and other group summary reports
- Summary reports of the company and association
- Sheet reports of calculation objects and other summary reports of calculation objects
Building reports that are key to the company is part of the implementation training.
Automation of reporting
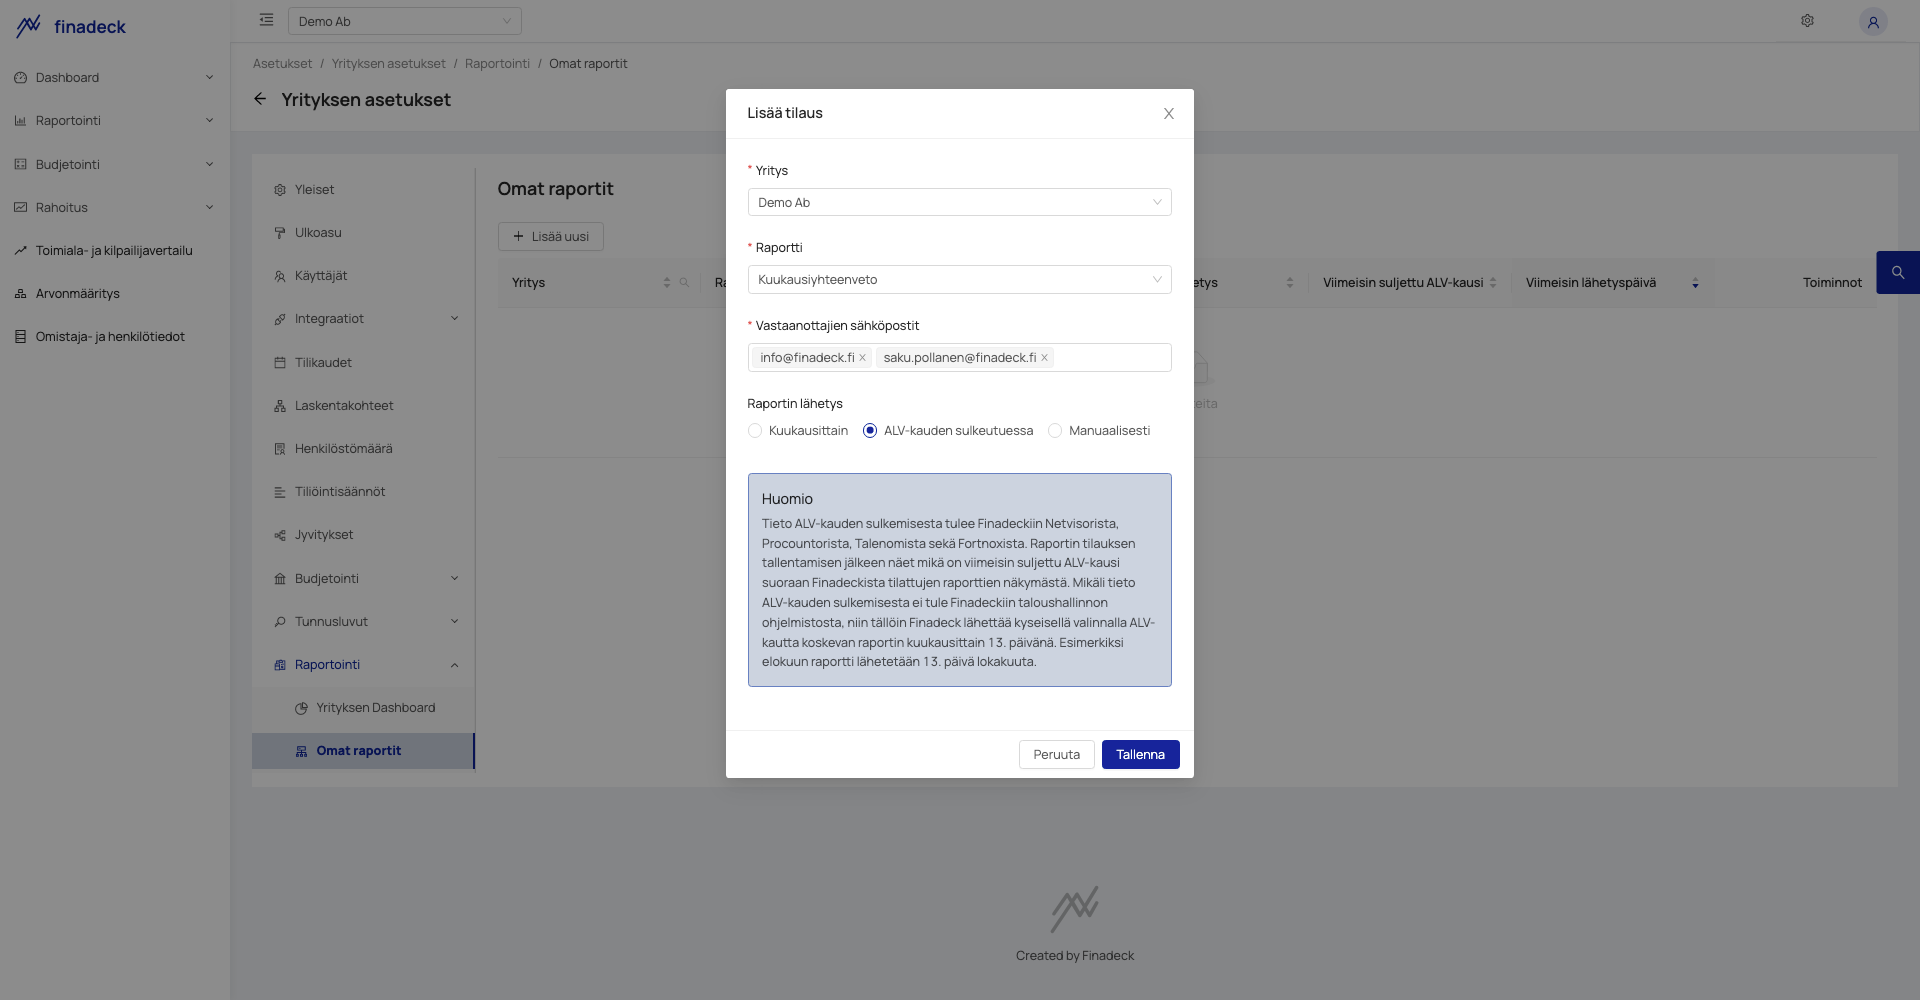
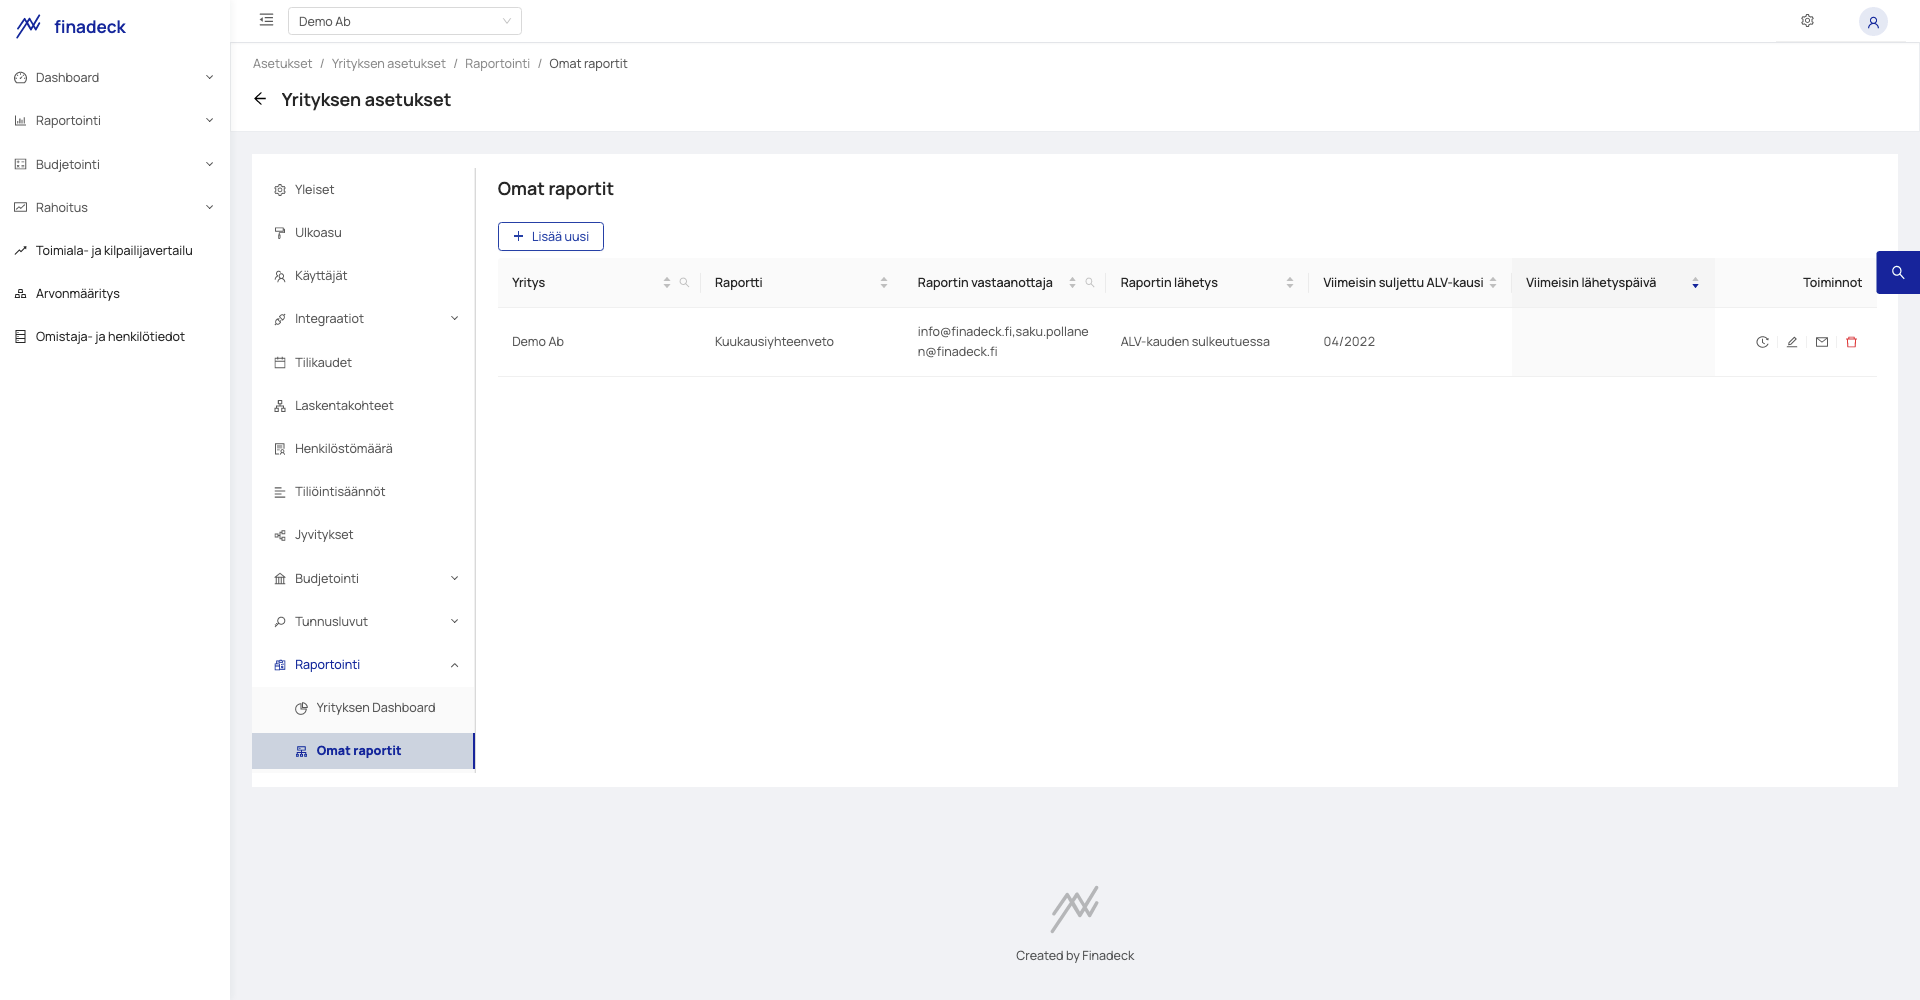
It is possible to order a PDF printout of the reports to be sent from Finadeck on a specific day of the month or when the VAT period closes to the emails of the desired persons, which allows management and board reporting to be automated.
