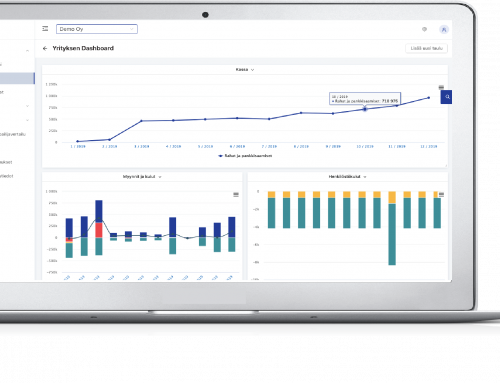
External metrics vs. internal metrics:

Overview of key figures

When looking at the company's operations, the key figures are divided into both external and internal key figures. External kpis are always calculated from the company's accounting data, while internal kpis can also be combined with data from external systems, such as the company's ERP system. In several cases, the majority of internal key figures can be calculated from the accounting data when the accounting accounts and cost centers are broken down at a sufficiently precise level. Unlike external indicators whose data is publicly available from financial reporting data, data from internal indicators is extracted deeper into accounting and ERP data that is not public.

Read more about external performances in Finadeck's blog "Tracking performance metrics (why, what and how) in vernacular"

External key figures

According to the term 'exterior' as a whole, the term 'external indicators' were used to audit the performance of the company. In general, the development of the whole is measured by the

  • scale and growth,
  • Profitability
  • liquidity and
  • Solvency

not only to be able to understand, direct and manage the whole, but also to analyse the industry and competitor.

Read more about the industry comparison in Finadeck's guest post "Keep track of how your company is doing relative to others and, if necessary, update the coordinates of your destination | Industry and competitor comparison"

Internal key figures

In turn, internal key figures are deepened into viewing different parts of the company, which can be viewed in more detail. Internal indicators can be used to consider, among other things, the

  • Productivity
  • Effectiveness
  • Flexibility
  • cost-effectiveness and
  • economy

Often internal indicators are industry-specific. This is because, for example, the real estate management company, the industrial company and the restaurant have different metrics due to the efficiency of the activities.

In practice, the company managing real estate can set internal representatives, for example, the occupancy rate and the income and expenses of each property in order to better understand the profitability of its investments.

For example, an industrial company can measure efficiency by setting production lead time as internal indicators and givingability by tracking sales margins within product groups. When calculating internal sales margins, an industrial company may deduct from the proceeds from the sale of the product group, in addition to purchases of materials and supplies and any subcontracting costs, for example, a weighted share of water and electricity costs for the product group in order to obtain a better picture of the margins of the product groups.

On the other hand, a company operating in the restaurant industry can measure the profitability of the whole with external indicators and elaborate on which product group's sales should be more focused on the profitability of its different product groups, such as food, drink, tobacco and other product groups.

Examples of internal key figures:

Sales

    \[ \: \textrm{Myynnin kustannusprosentti} \,=\frac{\mbox{Myyntikustannukset}}{\mbox{Myyntitulot}}*100 \]

Variable costs

    \[ \: \textrm{Tuoteyksikkökohtaiset kustannukset} \,=\frac{\mbox{Työ, Materiaali, Välittömät- ja Välilliset kustannukset}}{\mbox{Tuoteyksikkö}} \]

    \[ \: \textrm{Ylityöprosentti} \,=\frac{\mbox{Ylityötunnit}}{\mbox{Normaalit työtunnit}}*100 \]

Margins

    \[ \: \textrm{Toimintokateprosentti} \,=\frac{\mbox{Määrätyn toiminnon kate}}{\mbox{Koko yrityksen kate}}*100 \]

    \[ \: \textrm{Tuoteyksikkökohtainen käyttökate} \,=\frac{\mbox{Tuoteyksikön myyntitulo}}{\mbox{Tuoteyksikön työ, materiaali sekä välittömät- ja välilliset kustannukset}}*100 \]

    \[ \: \textrm{Tuoteyksikkökohtainen myyntikate} \,=\frac{\mbox{Tuoteyksikön myyntitulo}}{\mbox{Tuoteyksikön materiaali sekä välilliset kustannukset}}*100 \]

Fixed costs

    \[ \: \textrm{Henkilöstökuluprosentti} \,=\frac{\mbox{Henkilöstökulut}}{\mbox{Liikevaihto}} \]

    \[ \: \textrm{Kunnossapitokustannusseuranta} \,=\frac{\mbox{Kunnossapidon kokonaiskustannukset}}{\mbox{Tuotannon määrä}} \]

Productivity and efficiency

    \[ \: \textrm{Tuottavuus} \,=\frac{\mbox{Tuotoksen määrä}}{\mbox{Panosten määrä}} \]

    \[ \: \textrm{Työn tuottavuus 1} \,=\frac{\mbox{Tuotannon määrä}}{\mbox{Työntekijöiden määrä}} \]

    \[ \: \textrm{Työn tuottavuus 2} \,=\frac{\mbox{Jalostusarvo}}{\mbox{Palkkakustannukset}} \]

    \[ \: \textrm{Työn tuottavuus 3} \,=\frac{\mbox{Jalostusarvo}}{\mbox{Työntekijöiden määrä}} \]

    \[ Value added = Turnover - purchased materials, supplies, energy and services, i.e. the value added indicates the increase in the value of production as a result of the production process \]

    \[ \: \textrm{Koneaikasuhde} \,=\frac{\mbox{Koneaika työvaiheessa}}{\mbox{Koko vaiheaika}} \]

    \[ \: \textrm{Koneiden käyttösuhdeprosentti} \,=\frac{\mbox{Toteutunut käyntiaika}}{\mbox{Teoreettinen maksimikäyntiaika}}*100 \]

Quality

    \[ \: \textrm{Tarkastusvirheprosentti} \,=\frac{\mbox{Tarkastuksen läpäisseet vialliset kappaleet}}{\mbox{Kaikki tarkastetut}}*100 \]

    \[ \: \textrm{Laatutasoprosentti} \,=\frac{\mbox{Vastaanottotarkastuksessa hylätyt}}{\mbox{Toimittajan kaikki toimitukset}}*100 \]

    \[ \: \textrm{Virhekustannusprosentti} \,=\frac{\mbox{Virhekustannukset}}{\mbox{Myyntitulot}}*100 \]

Security

    \[ \: \textrm{Puuteprosentti} \,=\frac{\mbox{Puutteiden lukumäärä}}{\mbox{Toimitusten lukumäärä}}*100 \]

    \[ \: \textrm{Toimitusten myöhästymisprosentti} \,=\frac{\mbox{Myöhästyneet toimitukset}}{\mbox{Kaikki toimitukset}}*100 \]

Material handling

    \[ \: \textrm{Raaka-aineen kustannusseuranta} \,=\frac{\mbox{Raaka-ainekustannus}}{\mbox{Tuotettu tuote}} \]

    \[ \: \textrm{Käsittelyvaurioide seuranta} \,=\frac{\mbox{Käsittelyvauriot}}{\mbox{Kuljetusyksiköt}} \]

    \[ \: \textrm{Jäteprosentti} \,=\frac{\mbox{Jätteen määrä}}{\mbox{Materiaalien käyttö}}*100 \]

Staff

    \[ \: \textrm{Tapaturmataajuus} \,=\frac{\mbox{Tapaturmien lukumäärä}}{\mbox{10 miljoonaa työtuntia}} \]

    \[ \: \textrm{Tapaturmien vakavuus} \,=\frac{\mbox{Sairauspäivien lukumäärä}}{\mbox{Tapaturmien lukumäärä}} \]

    \[ \: \textrm{Poissaoloprosentti} \,=\frac{\mbox{Poissaolopäivien  lukumäärä}}{\mbox{Työpäivien lukumäärä}}*100 \]

    \[ \: \textrm{Työntekijöiden vaihtuvuus} \,=\frac{\mbox{Eronneet työntekijät}}{\mbox{Keskivahvuus}} \]

    \[ \: \textrm{Rekrytointikustannusseuranta} \,=\frac{\mbox{Rekrytointikustannukset}}{\mbox{Palvelukseen palkatut}} \]

    \[ \: \textrm{Koulutusseuranta} \,=\frac{\mbox{Koulutuskustannukset}}{\mbox{Työntekijä}} \]