Monitoring key figures (why, what and how) in the vernacular
In an earlier article on budgeting, javelin thrower Herra A aimed to cross the magical 90-metre mark at the home race at least a month before the Olympics. Mr B's main objective was exactly the same, but he also set himself annual, quarterly and monthly milestones. But how would he measure his development as simply and efficiently as possible?
Key figures
The intermediate goals of an athlete's training consist of goals for speed, strength, endurance, nutrition and rest. With smaller parts balanced, it is likely that the athlete will achieve the main goal without unwanted injuries.
The company's equilibility and financial capacity are usually examined in tripartite terms by its profitability (speed and strength), liquidity (sustainability) and solvency (nutrition and rest) indicators. Nowadays, when the cash-based mindset rears its head, the key figures for working capital (mobility) are often included in the review.
In this article, I will provide an illustrative overview of the company's key indicators. You will learn the benefits that can be achieved with the objectives attached to the key figures and their follow-up, and also tell others about the key figures in the national language.
Profitability and efficiency
In sport, speed measurement is often done by comparing the maximum short-term speed or the average speed of the longer distance. On the other hand, the measurement of power levels is often carried out by measuring maximum force and strength resistance. In the business world, it is customary to distribute profitability indicators in the same way to revenue and margin measures relative to turnover and to capital-related profit indicators.
Gross margin, EBITDA and financial results are indicators obtained by comparing turnover. By looking at them, you can find out short-term returns and margins, for example on a monthly basis. On the other hand, capital-related income indicators are used to look at longer-term margins , such as the financial year or rolling 12-month margins.
Revenue and margin indicators relative to turnover
- €- and % gross margin, EBITDA and operating result, as well as their derived internal gross margins and EBITDA, for example, for measuring margins for a particular product or service group.
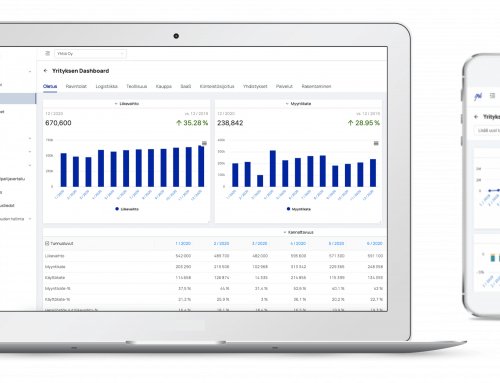
- Turnover per person for measuring efficiency.
Note! Because a company can also purchase the resources it needs from a subcontractor, personal efficiency indicators are in some cases unverse. However, they are practical indicators for intra-company use, including the creation of common goals. When comparing business-to-business EBITDA, it is also worth noting that EBITDA is affected by, among other things, whether the company rents or owns fixed asset machinery and equipment. This is because, unlike rents, depreciation does not reduce EBITDA.
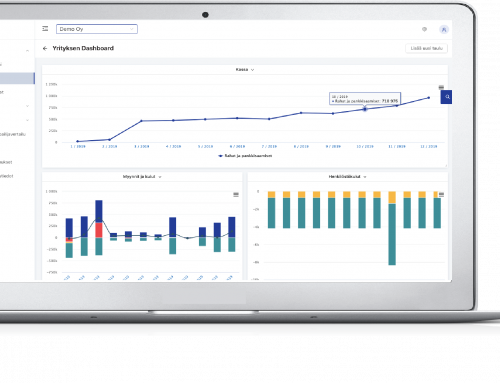
- The financial result reflects the cash impact of operational activities, which is one of the most important things to monitor.
- If an enterprise is part of a group or also has extraordinary one-time liable income, it is also worth looking at net income and total income.
Capital-related performance indicators
Liquidity
To shed light on the weak liquidity, you can imagine a 100-metre runner who can run 50 metres hard and then look at the rudders of the other runners. It is clear that a runner should adjust their goals with speed resistance and strength resistance indicators instead of explosive speed and force metrics. It is also worth investigating whether nutrition and rest are unbalanced.
Liquidity indicators tend to be divided intoquick and current ratiosand dynamic liquidity and cash flow indicators (financial performance and operating balance). Assimilated to sustainability, quick ratio and current ratio describe the company's ground condition and operating residue development.
Solvency
The balance of nutrition and rest lays the foundation for the continuous development of the runner. If nutrition and rest are not balanced, the development of speed and endurance will inevitably stop. The key figures below describe the solvency of the company, "nutrition and rest of the runner."
Financial structure indicators
Dynamic indicators of financial adequacy
Working capital
It is important for athletes to have the opportunity to train freely and versatilely. A little equally, the agility of working capital is good for business. If the cash reserves have to be tied up too much in stocks, in the form of payment periods for long sales invoices or in the form of payment periods for non-existent purchase invoices to finance suppliers, the company's cash position will quickly become burdened. An empty register combined with rigid terms from suppliers and long payment periods for customers can lead to an end of business when rolling wages and other fixed costs cannot be paid.
Key indicators for working capital
If the operation requires storage, then so does the
- Working Capital %
- Net working capital %
- Inventories / turnover
Summary
The noble art of utilising key figures belongs to the reperttuary of every business professional. In short, when milestones are carefully monitored at management level, all parties are put on the same page, the company's ability to function increases and financial risk decreases. Reactivity gives way to proactivity, which means that different scenarios can be prepared in advance.
Human resources management also hits its target better when there is a clear picture of the company's financial situation. Monitoring milestones in itself sends a message to the staff that the company's reins are in certain hands. It is worth noting that milestones set for a company can lead to incentives for staff. All this motivates and engages staff, which is usually reflected in the results.
Check out the other articles in the article series mentioned below:
Logic of the profit and loss account and balance sheet in vernacular
Cash flow statement in vernacular
Finadeck's intelligent FINANCIAL Management and Reporting software is designed to make it easier for companies to analyze key figures and cash flow, as well as – visual reporting, budgeting, investment planning, industry and competitor comparison, valuation and financial search.