Reporting – five tips for building and utilising BI reporting
In measuring and developing business, it is of paramount importance that they are based on tried and tested and proven practices in the industry. These are what I have discussed in my previous articles on the logic of the result and balance sheet, the cash flow statement, key figures and budgeting.
In this post, I will address the future-forward-looking approach, which is the optimal course of action in business. How can it be promoted in financial management and reporting, some of which are demanding and time-consuming?
Let's imagine a blind helmsman who, in the midst of a storm, controls the ship no matter what. He won't react until he's already run aground. Removing the bandage in front of the eyes is, of course, the first step to improve the prognosis. But if a modern navigation system were installed for the helmsman, how much more affordable could the future look?
How to build BI reporting
Business management includes routine tasks that require accuracy as well as deeper management of large entities. At the same time, we should look at markets and technologies that are developing at a rapid pace. It makes sense to outsource these activities to an accountant or financial management expert. However, this does not change the fact that a professional in the field also faces challenges in his work.
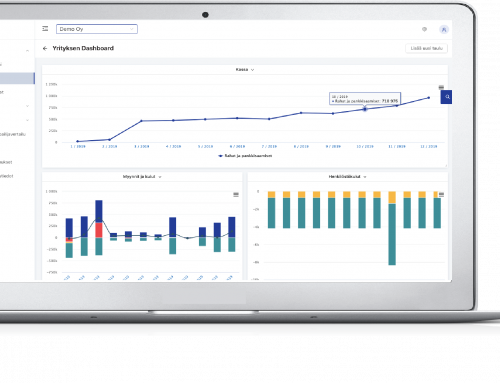
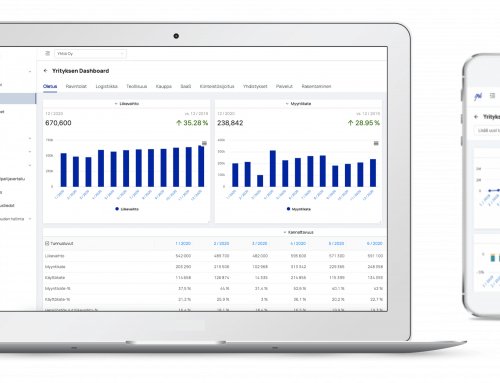
Reviews of financial situation and key business figures can be significantly streamlined by introducing visual tools that reflect the financial metrics, i.e. BI dashboard (financial and business control panel). If the old saying "image says more than a thousand words" seems like an exaggeration, then at least in perceiving the business with visual presentations, there is a considerable advantage. Man when he's a strongly visual being.
As everyone who has worked well on the company's finances knows, it can be laborious to understand the financial situation and its development through numbers alone. However, it is possible to change the figures to a visual format, making them more concrete for the reader. It illustrates and speeds up the internalized and processing of numbers. This will provide a more accurate understanding of the state of the business more quickly.
Secondly, visual representations, when used correctly, ensure that the right people receive essential information in an understandable form. This is one of the most important goals of financial reporting in a world where sustainable decisions must be made with scarce resources.
For example, if a company has multiple cost centers and projects, the project manager can focus on looking at the profitability and effectiveness of the projects he or she is leading from tailored visual graphs. It doesn't take a person's time to search for, calculate, and understand numerical reports how well the project has stayed in the budget in light of the numbers, and so on.
A more detailed picture of the company's finances is also a fertile starting point for managing and engaging personnel. Targeting and proper rewards for business development become everyone's business. When the direction is common and the spirit is good, you can usually expect results.
Visual tools contribute to building the company's predictability, which means that reactivity becomes proactive. At the same time, savings in costs and time use will be achieved. Business becomes more sustainable. But how exactly do you enable the dashboard?
What things to consider in BI reporting
A company's navigation system, or dashboard, must always serve the company's business, its monitoring and finances. There can be more than one dashboard to track goals, and another to track your company's overall financial situation. External information can also be attached to dashboard metrics, for example, for calculating more accurate product-specific profitability or labour productivity.
With these five tips, you can get started building your own navigation system:
- Review the company's financial targets
- Select or customize the key figures that are best suited for monitoring financial status
- Follow the instrument panel to avoid any extra surprises
- Agree with your staff routines for reviewing and developing financial indicators, for example, monthly, every three months or every six months
- If necessary, develop the instrument panel to be more suitable for needs by including data from systems outside financial management
Some financial management activities are inevitably complex. There is also a lot of responsibility involved. A good option is to outsource them to an accountant or financial management expert. However, that does not change the fact that, from afar, wise economic management consists of constant care and self-improvement. This also applies to those whose eyes have already been trained for it.
Check out the other articles in the article series mentioned below:
Logic of the profit and loss account and balance sheet in vernacular
Cash flow statement in vernacular
Monitoring key figures (why, what and how) in the vernacular
Finadeck's intelligent FINANCIAL Management and Reporting software is designed to make it easier for companies to analyze key figures and cash flow, as well as – visual reporting, budgeting, investment planning, industry and competitor comparison, valuation and financial search.